Maximus, Inc.'s management explains the business in its own materials. The slides below do the most of that work, pulled from the documents preserved in Sources. Each source link opens the complete presentation at that slide in a new tab.
The standing company overview: what Maximus does for governments, the three segments, how contracts pay, and the financial model. · Open the full document →
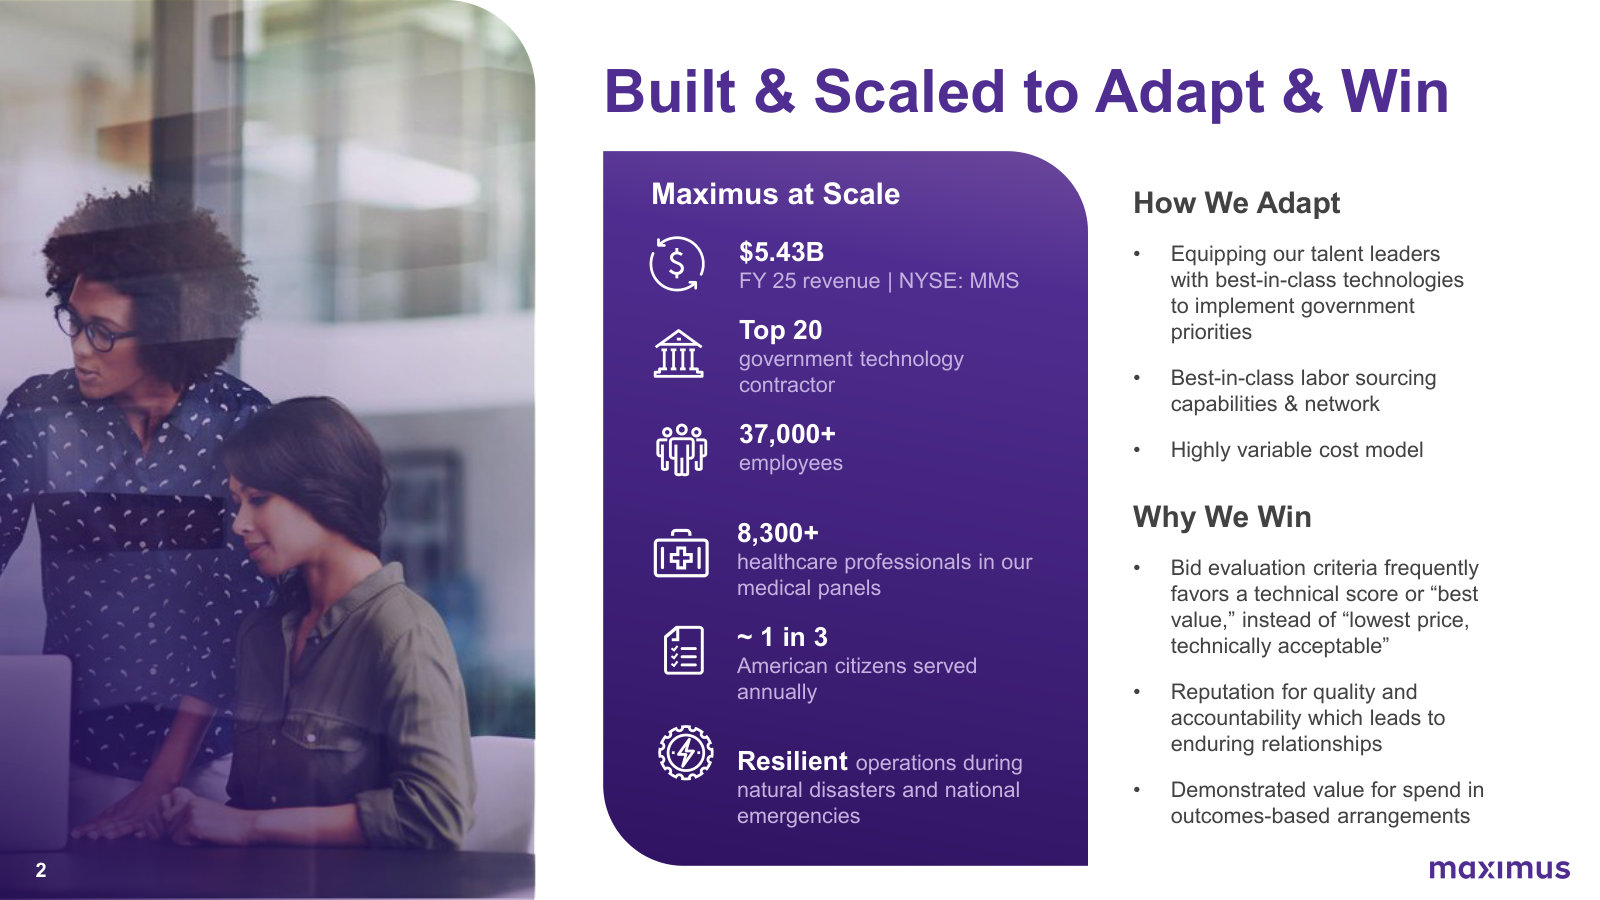
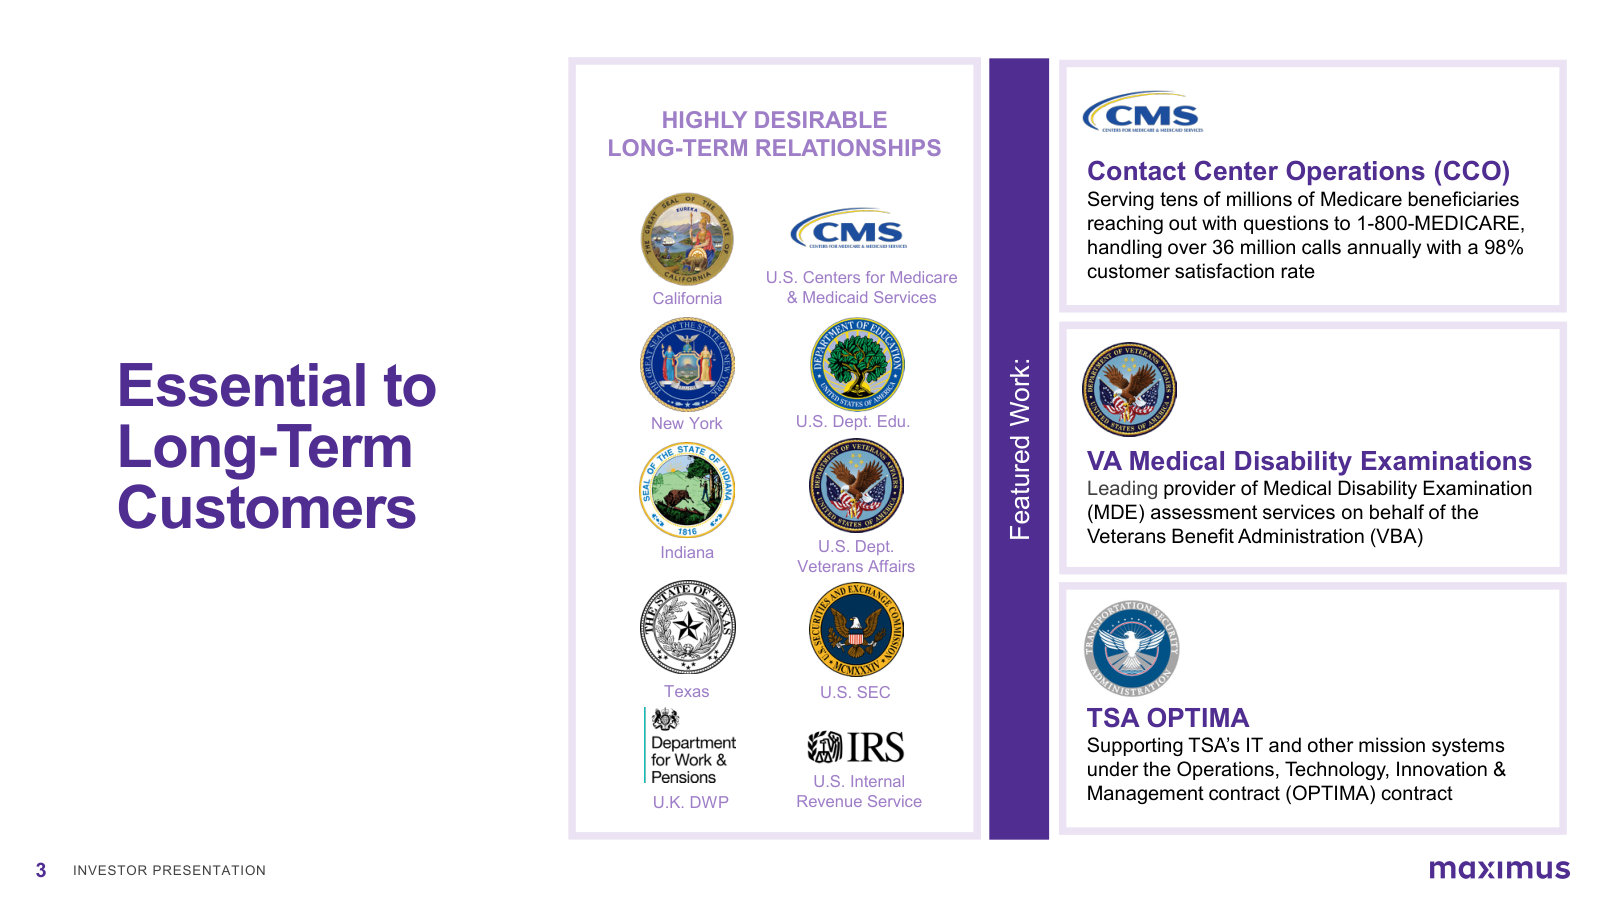
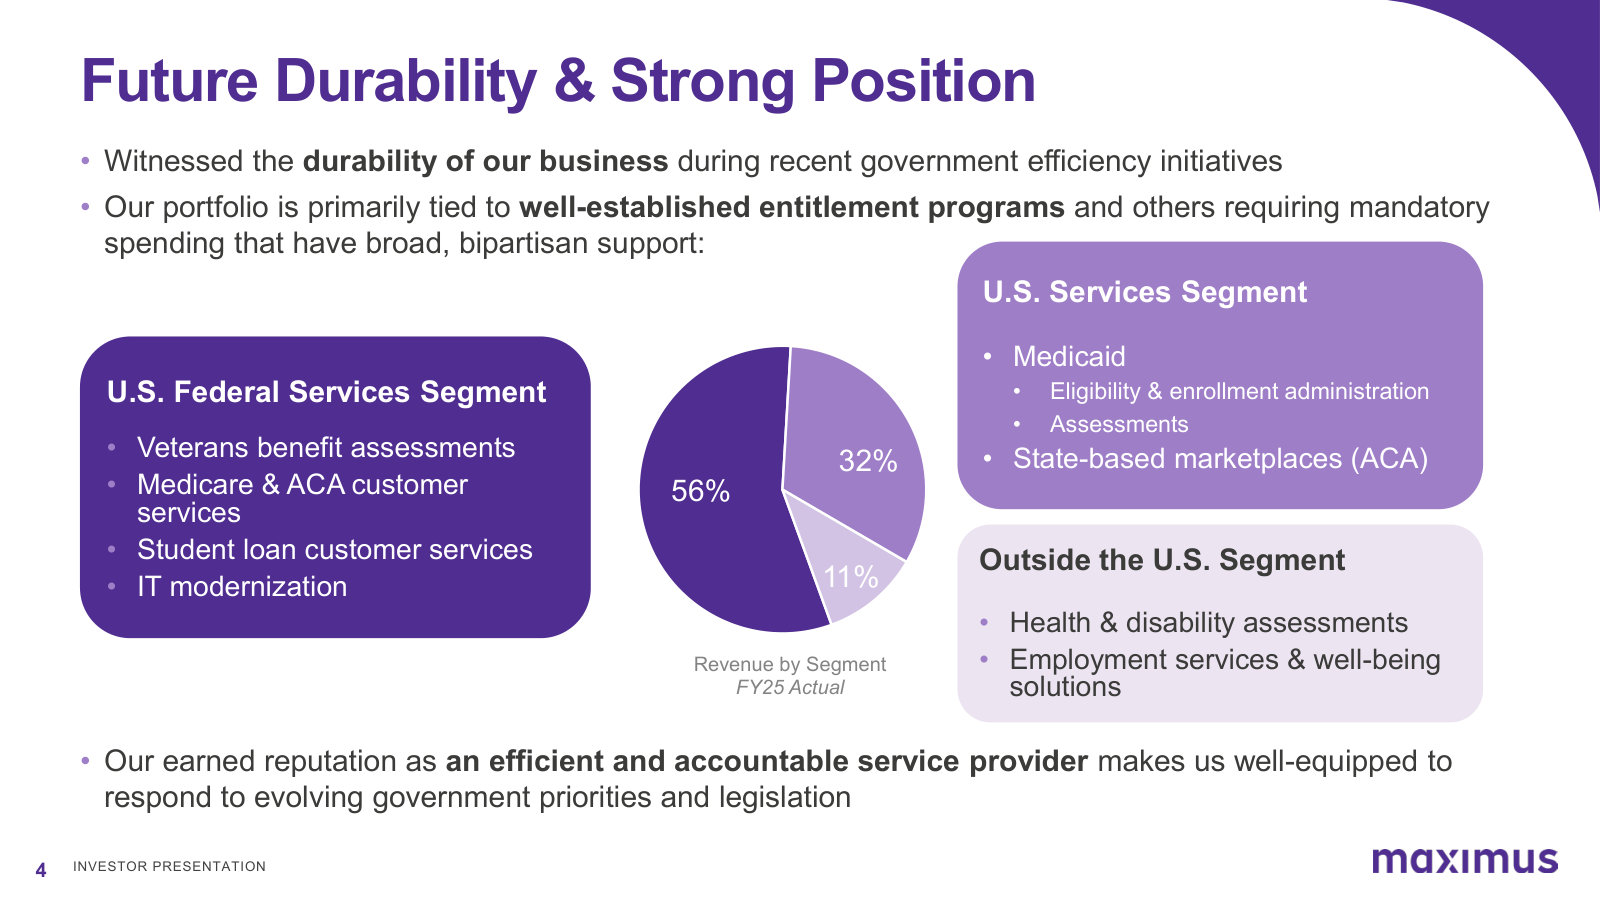
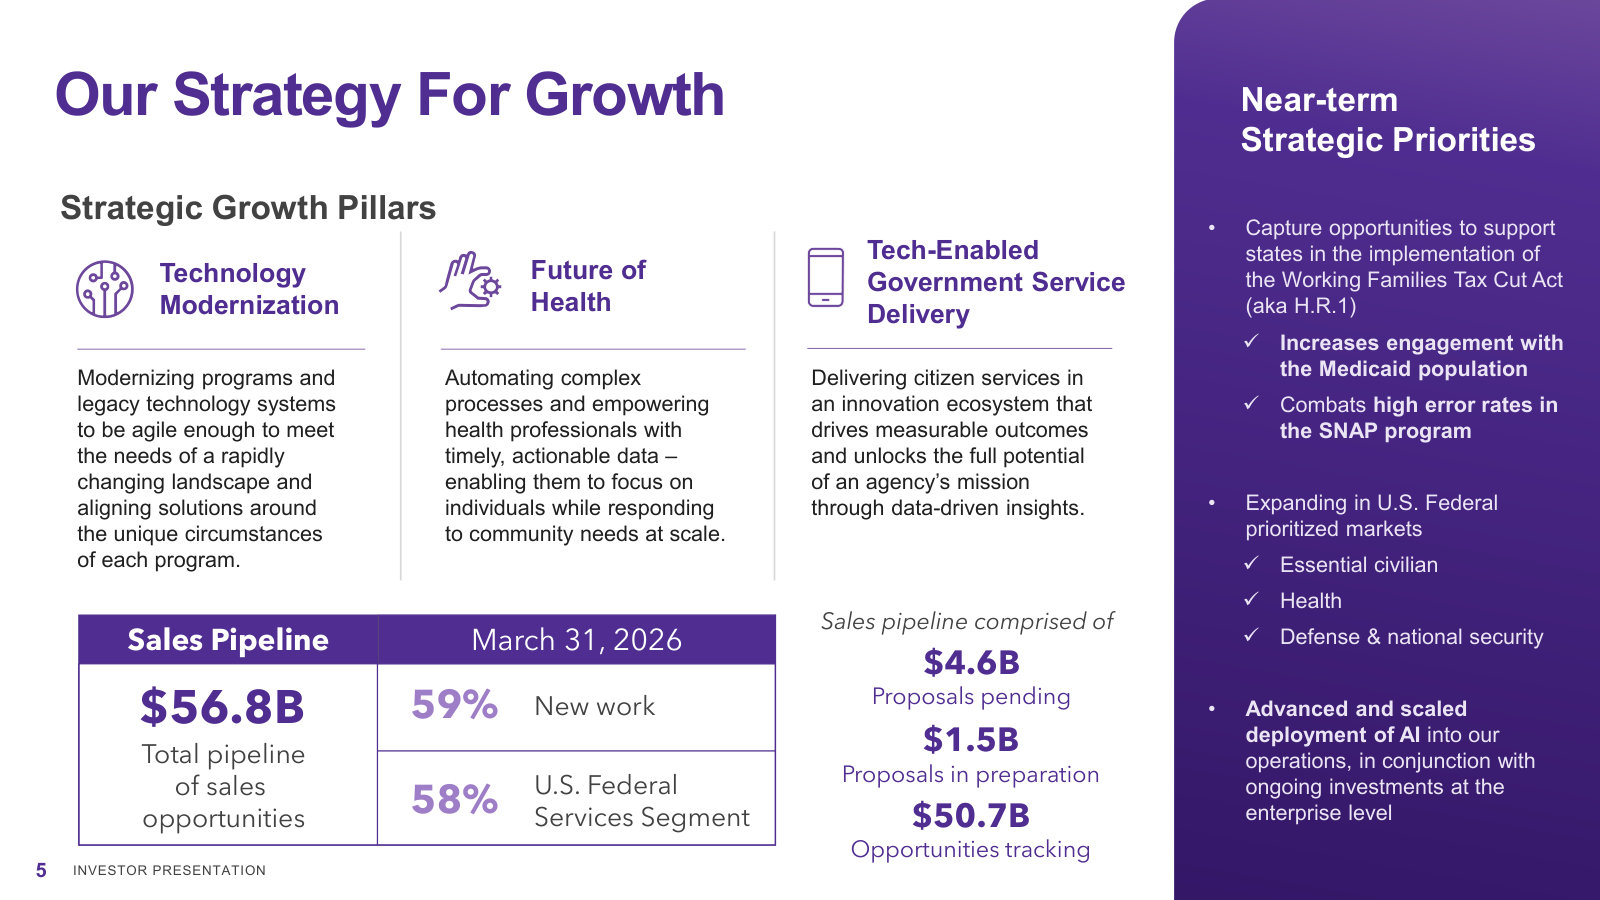
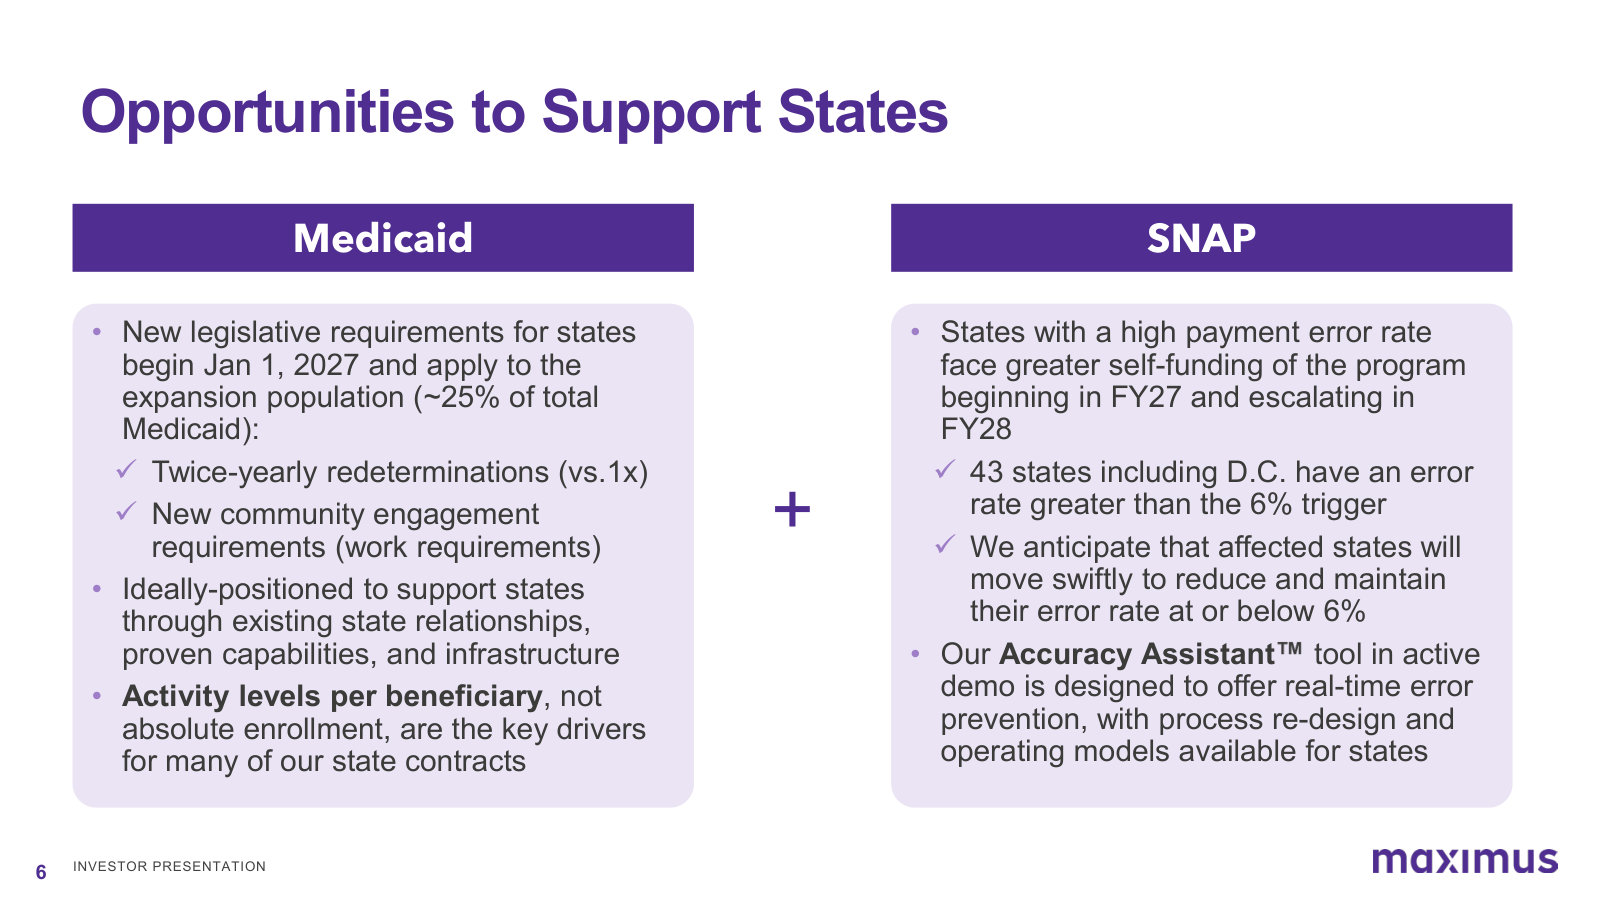
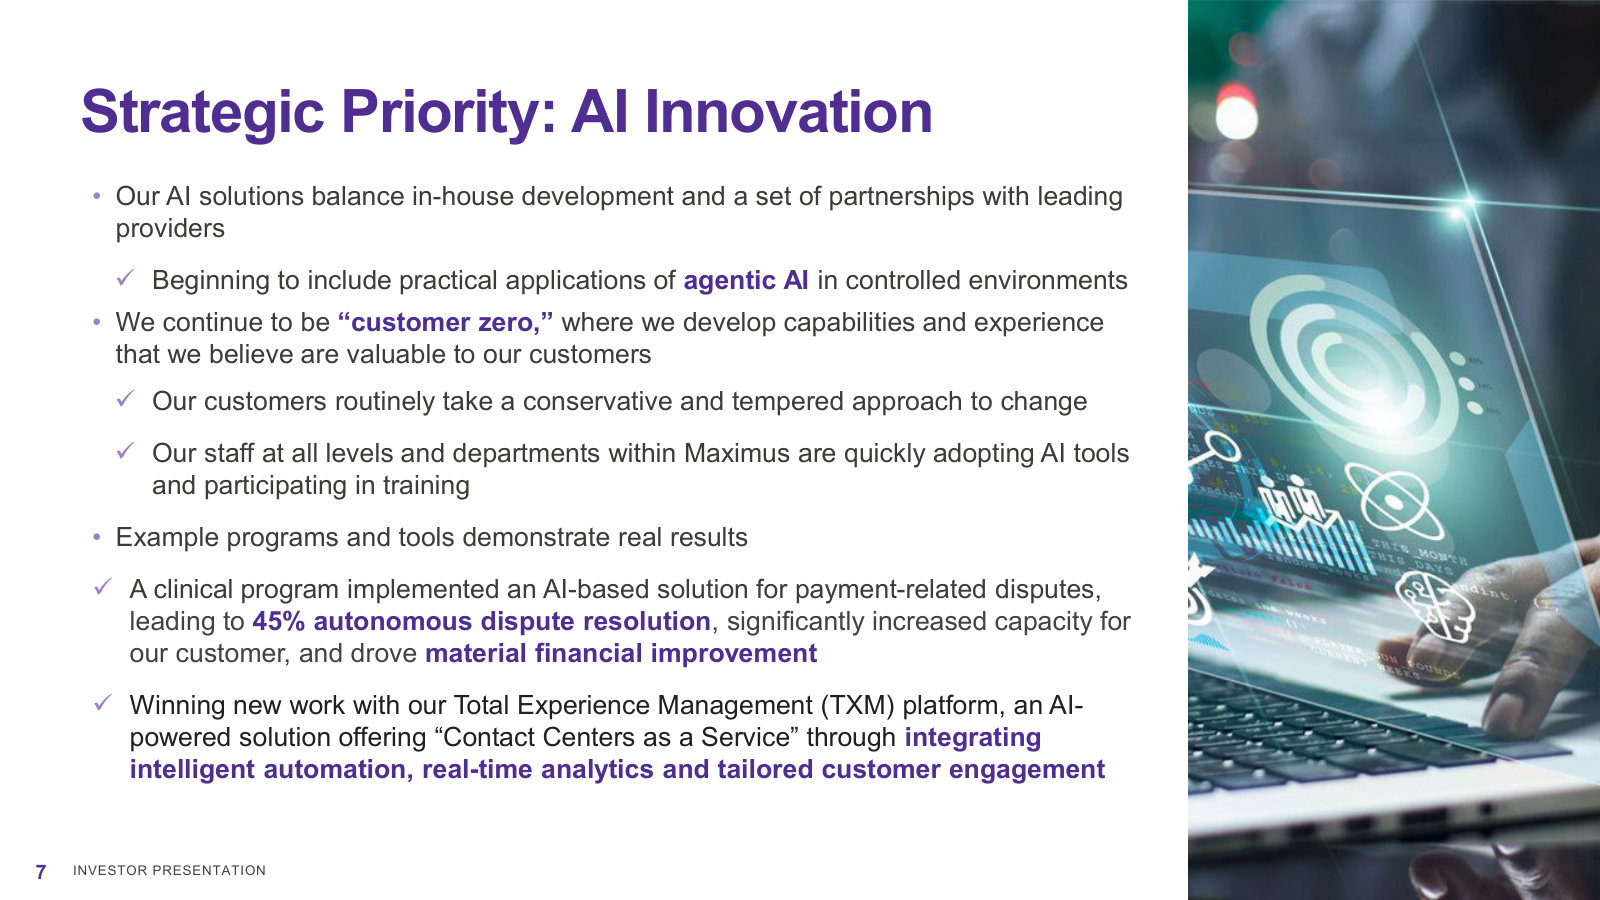
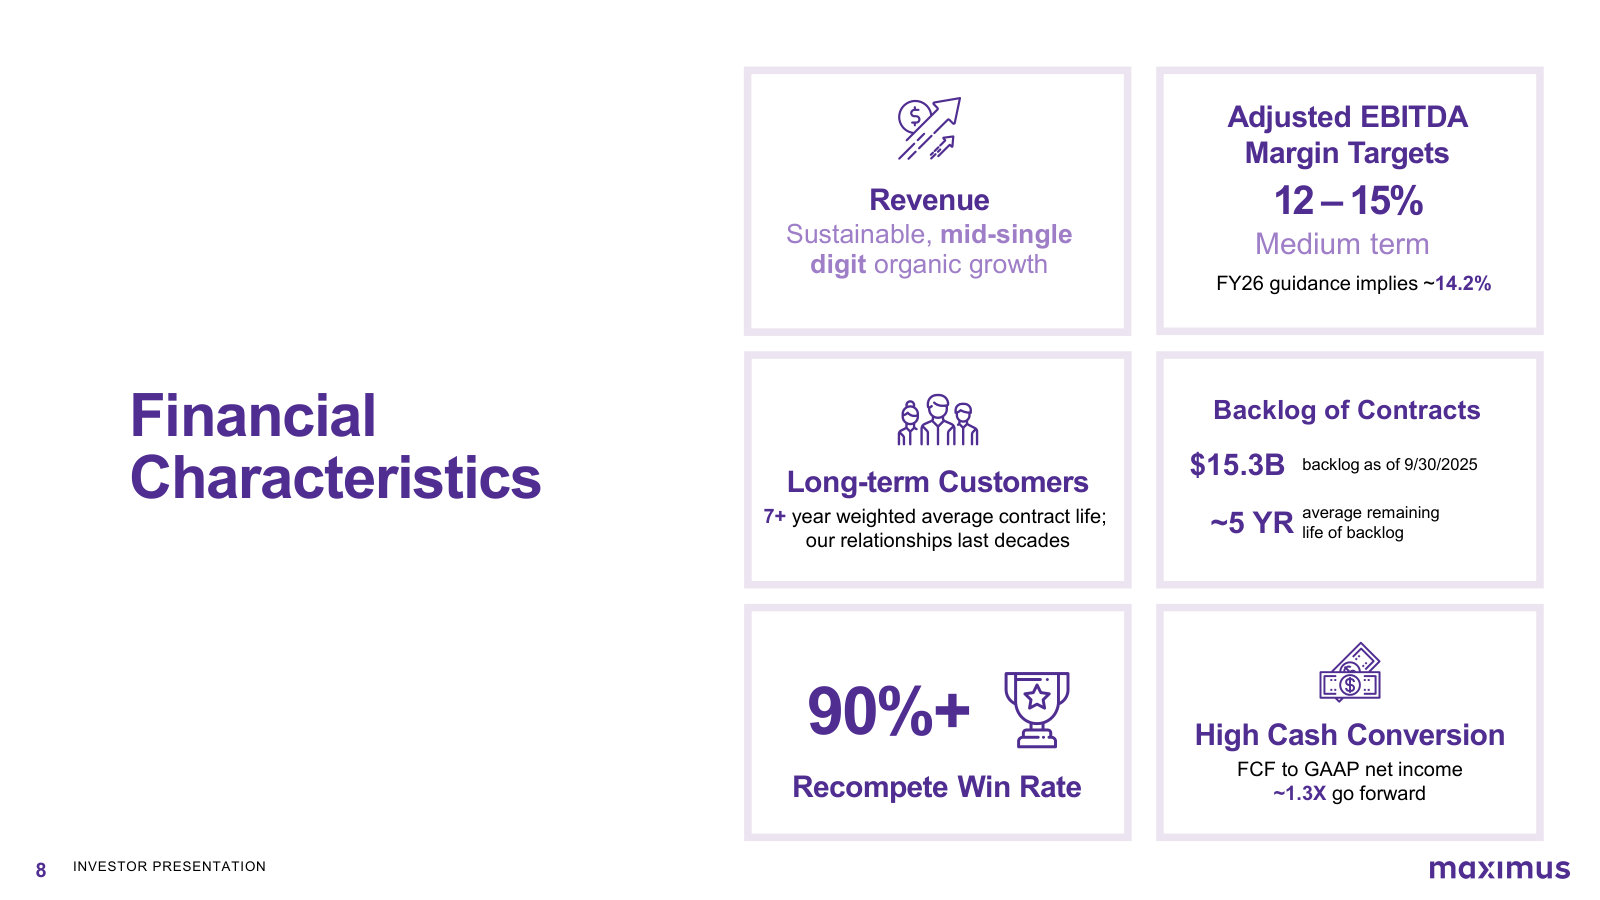
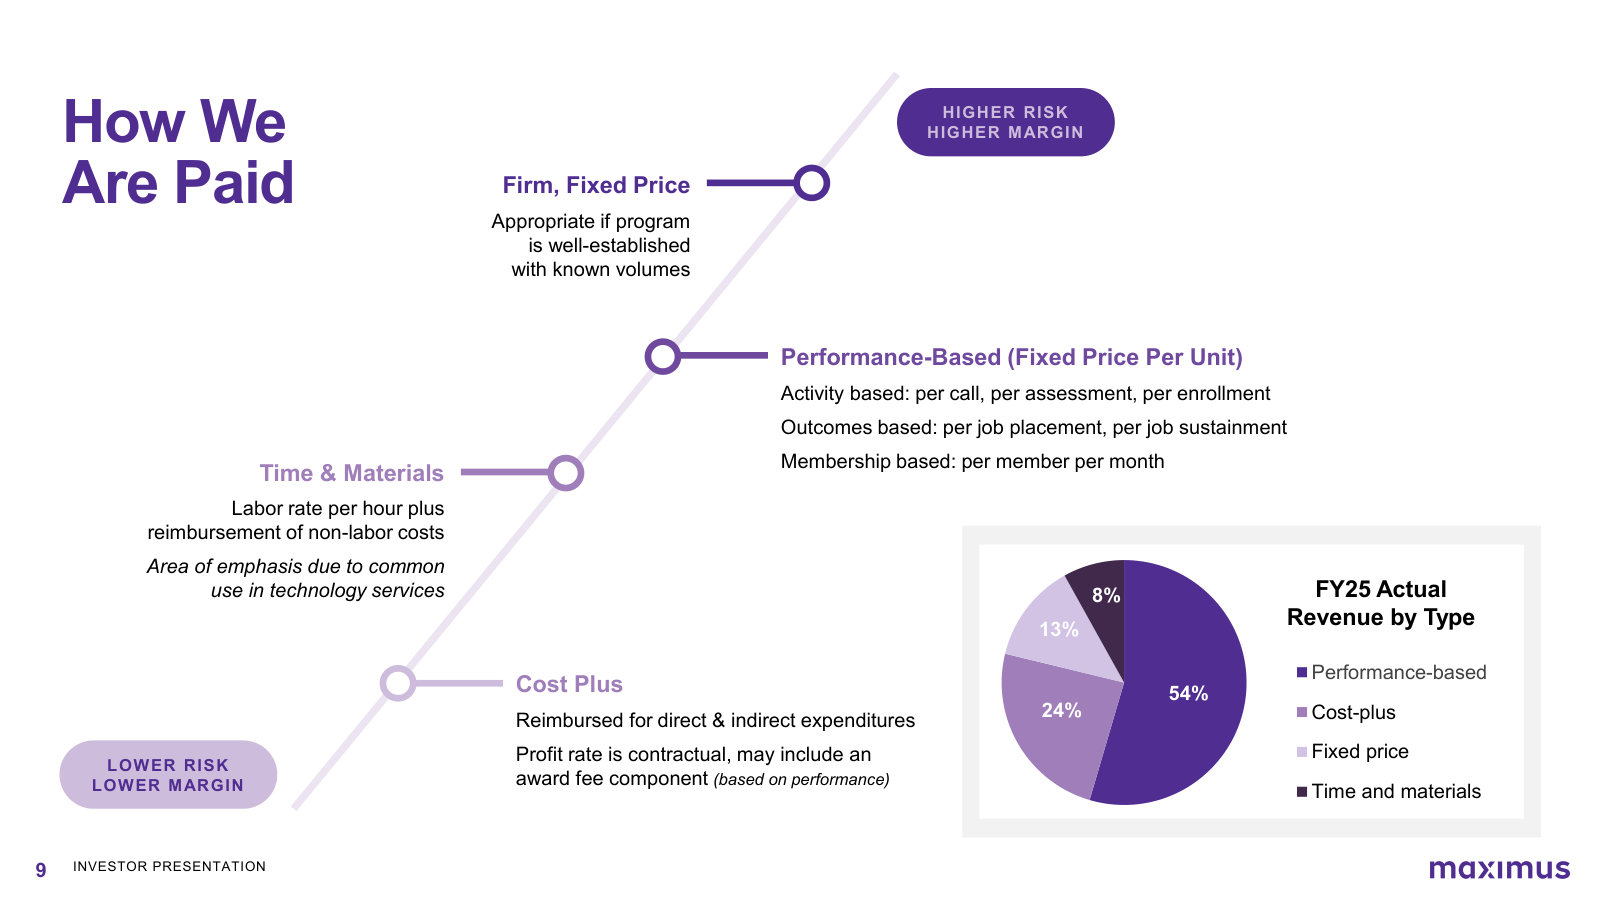
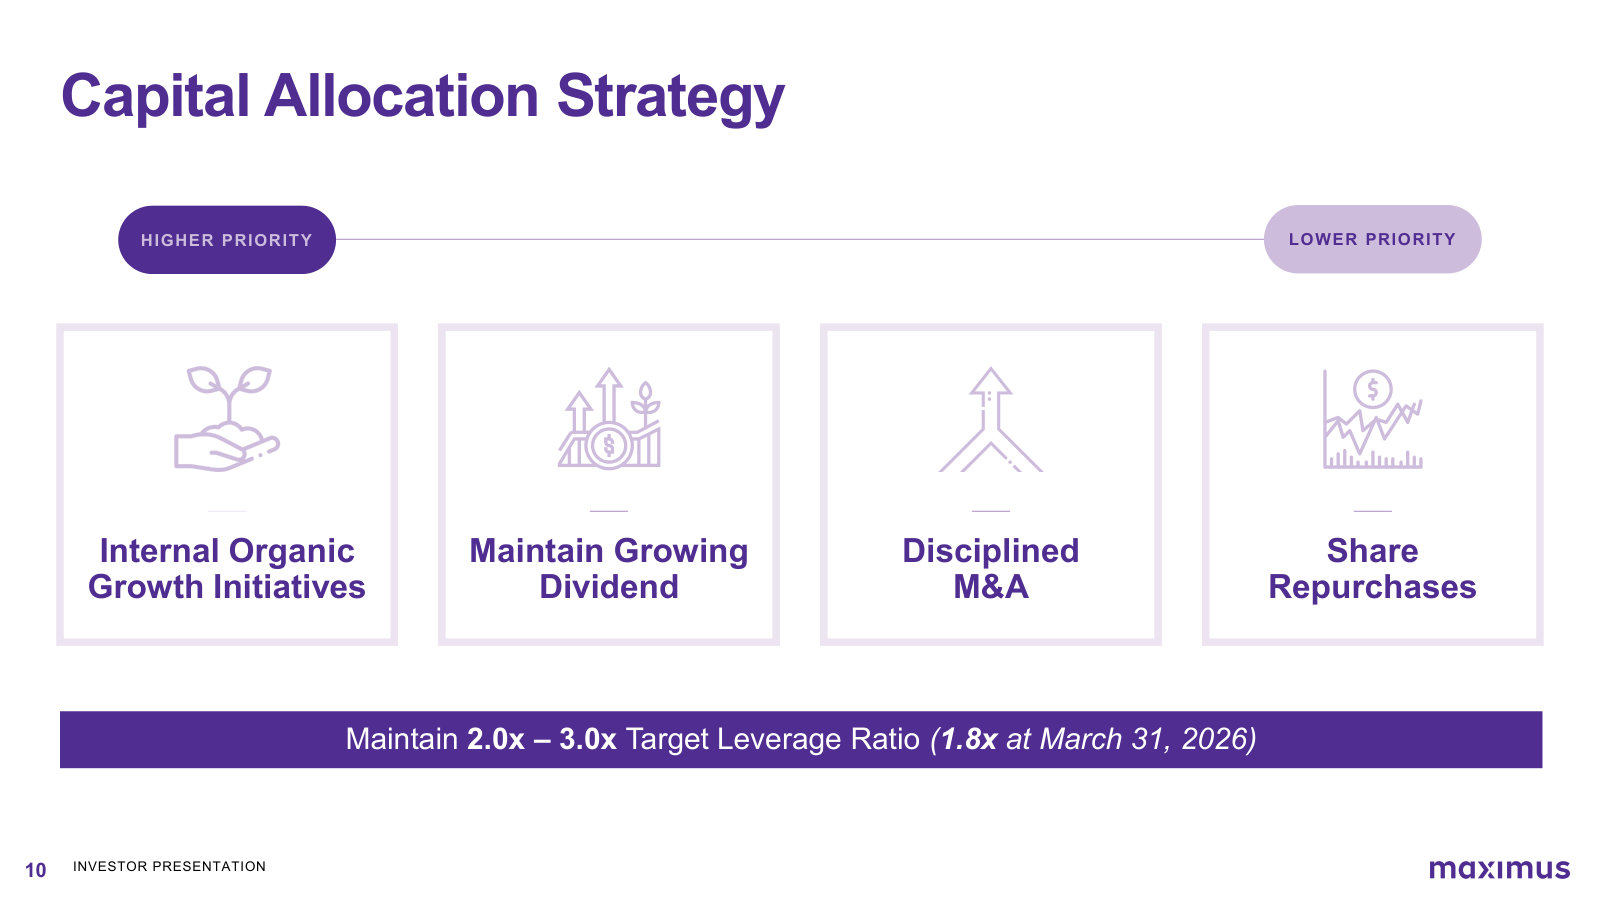
p. 2 — Scale and the two-part argument: how a variable-cost labor model adapts, and why bids scored on "best value" favor incumbency. · Open the full presentation →p. 3 — The customer list is the business — CMS, VA, IRS, U.K. DWP, big states — with 1-800-MEDICARE and VA disability exams as flagships. · Open the full presentation →p. 4 — Segment map and the FY25 revenue split: U.S. Federal 56%, U.S. Services 32%, Outside the U.S. 11%, with the programs behind each. · Open the full presentation →p. 5 — The three growth pillars against a $56.8B pipeline that is 59% new work and 58% federal, plus the near-term priorities. · Open the full presentation →p. 6 — The H.R.1 opportunity: twice-yearly Medicaid redeterminations and work requirements from 2027, SNAP penalties hitting 43 states. · Open the full presentation →p. 7 — How AI is deployed — "customer zero" internally, 45% autonomous dispute resolution in a clinical program, TXM as the product. · Open the full presentation →p. 8 — The model in six numbers: mid-single-digit organic growth, a 12–15% EBITDA target, $15.3B backlog, 90%+ recompete win rate. · Open the full presentation →p. 9 — Contract types ranked by risk and margin, with the FY25 mix: 54% performance-based, 24% cost-plus. The key slide for margins. · Open the full presentation →p. 10 — Capital allocation priorities in order, and the 2.0x–3.0x target leverage range against 1.8x actual. · Open the full presentation →
The latest quarter: current segment margins, raised FY26 guidance, and management's read on procurement delays and AI. · Open the full document →
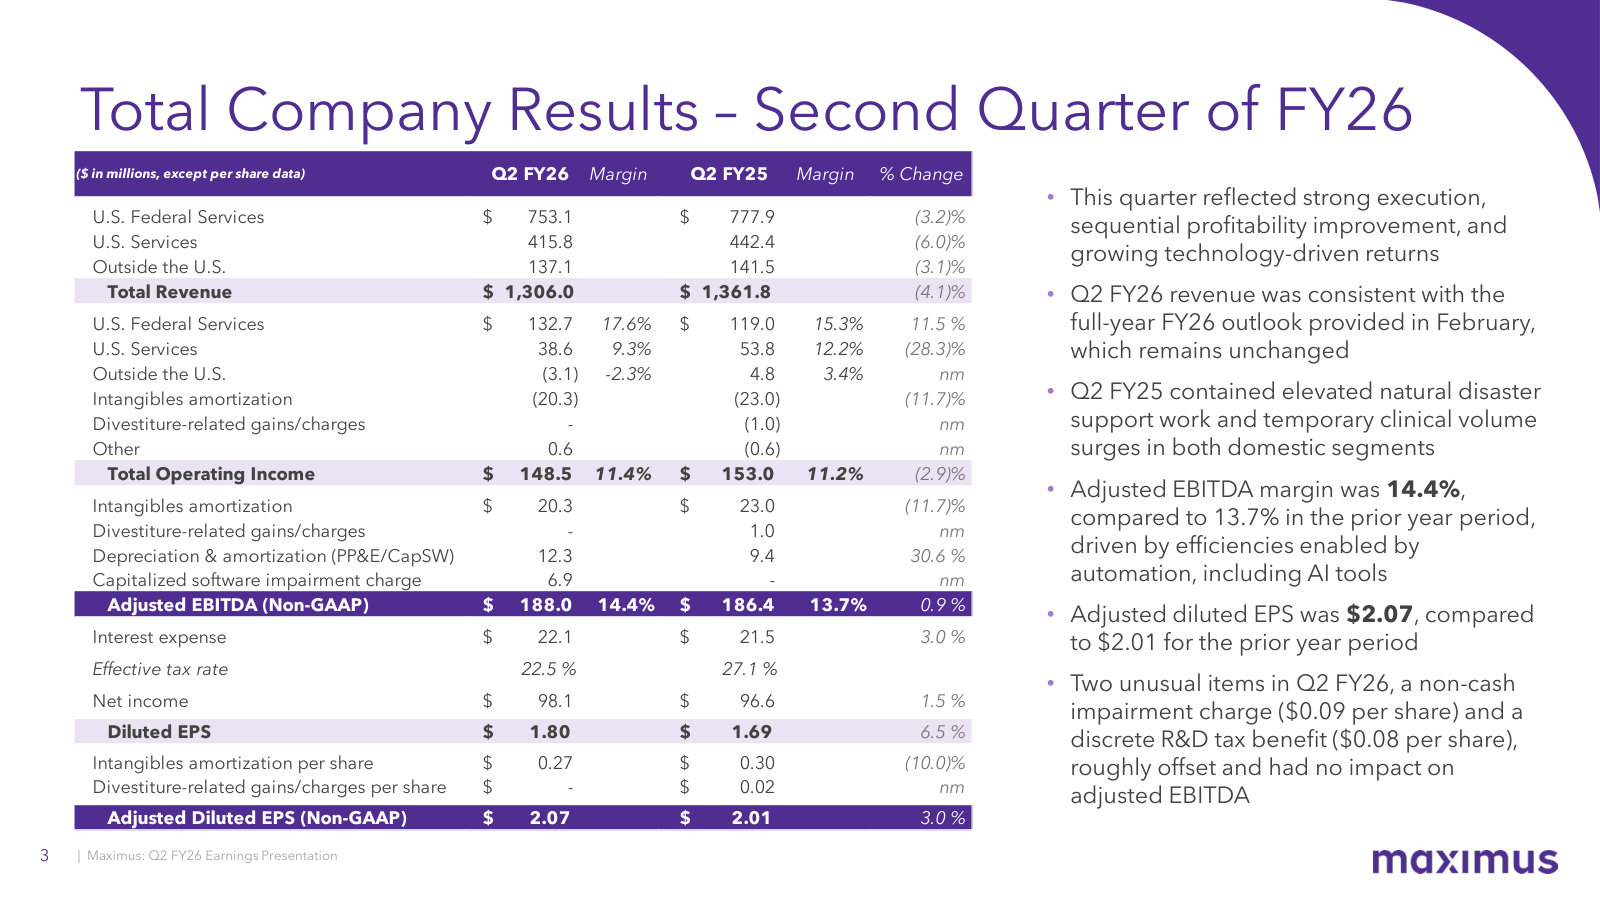
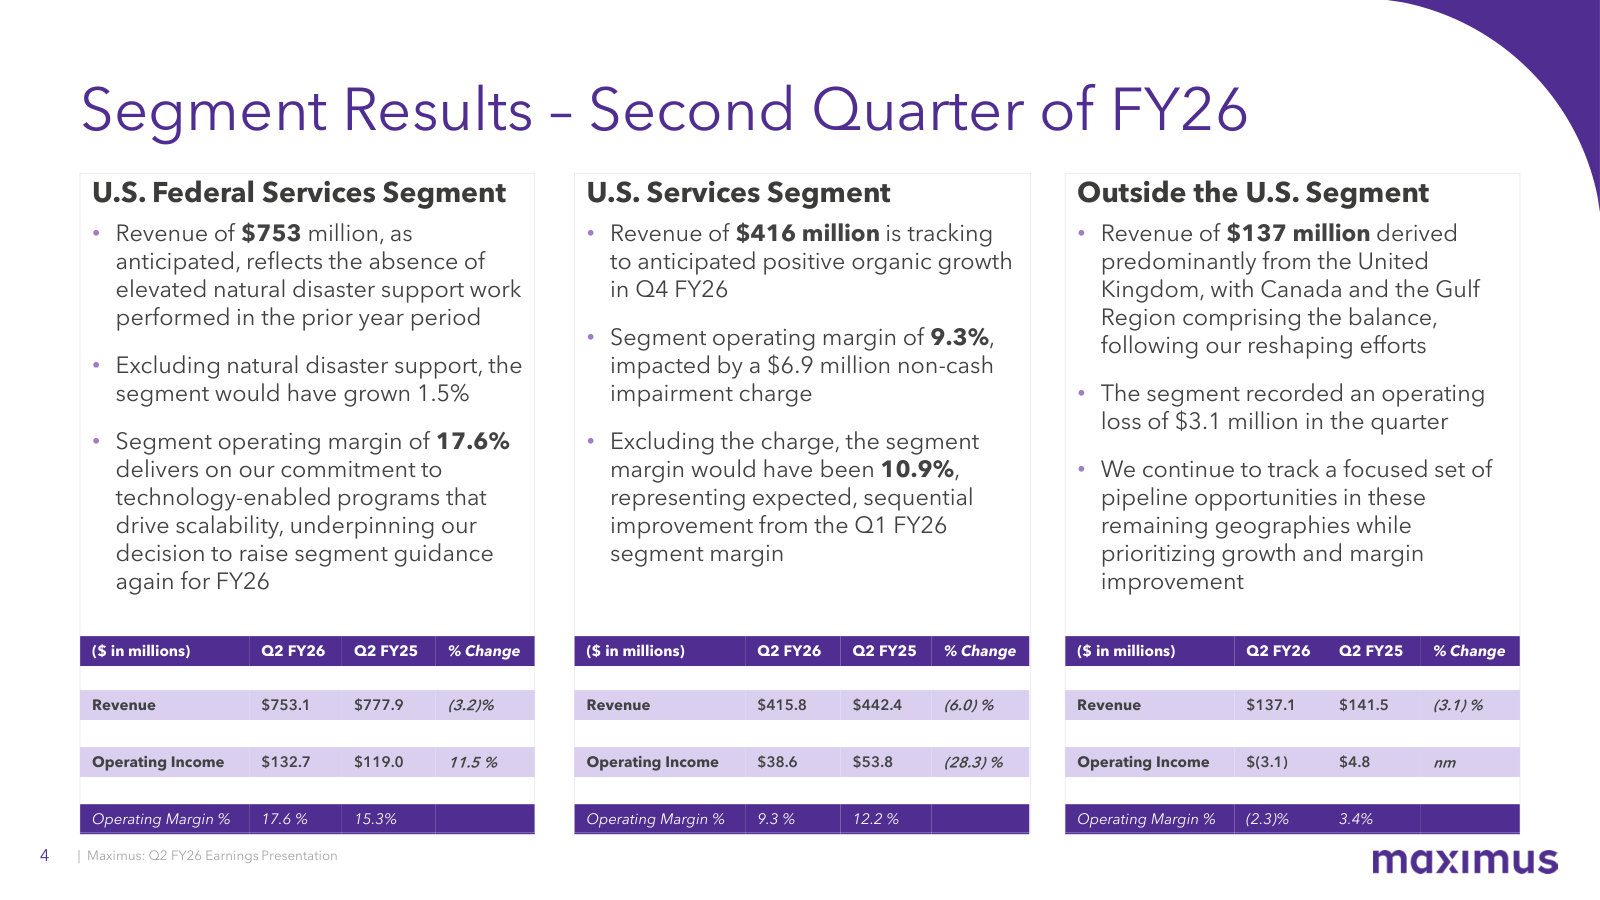
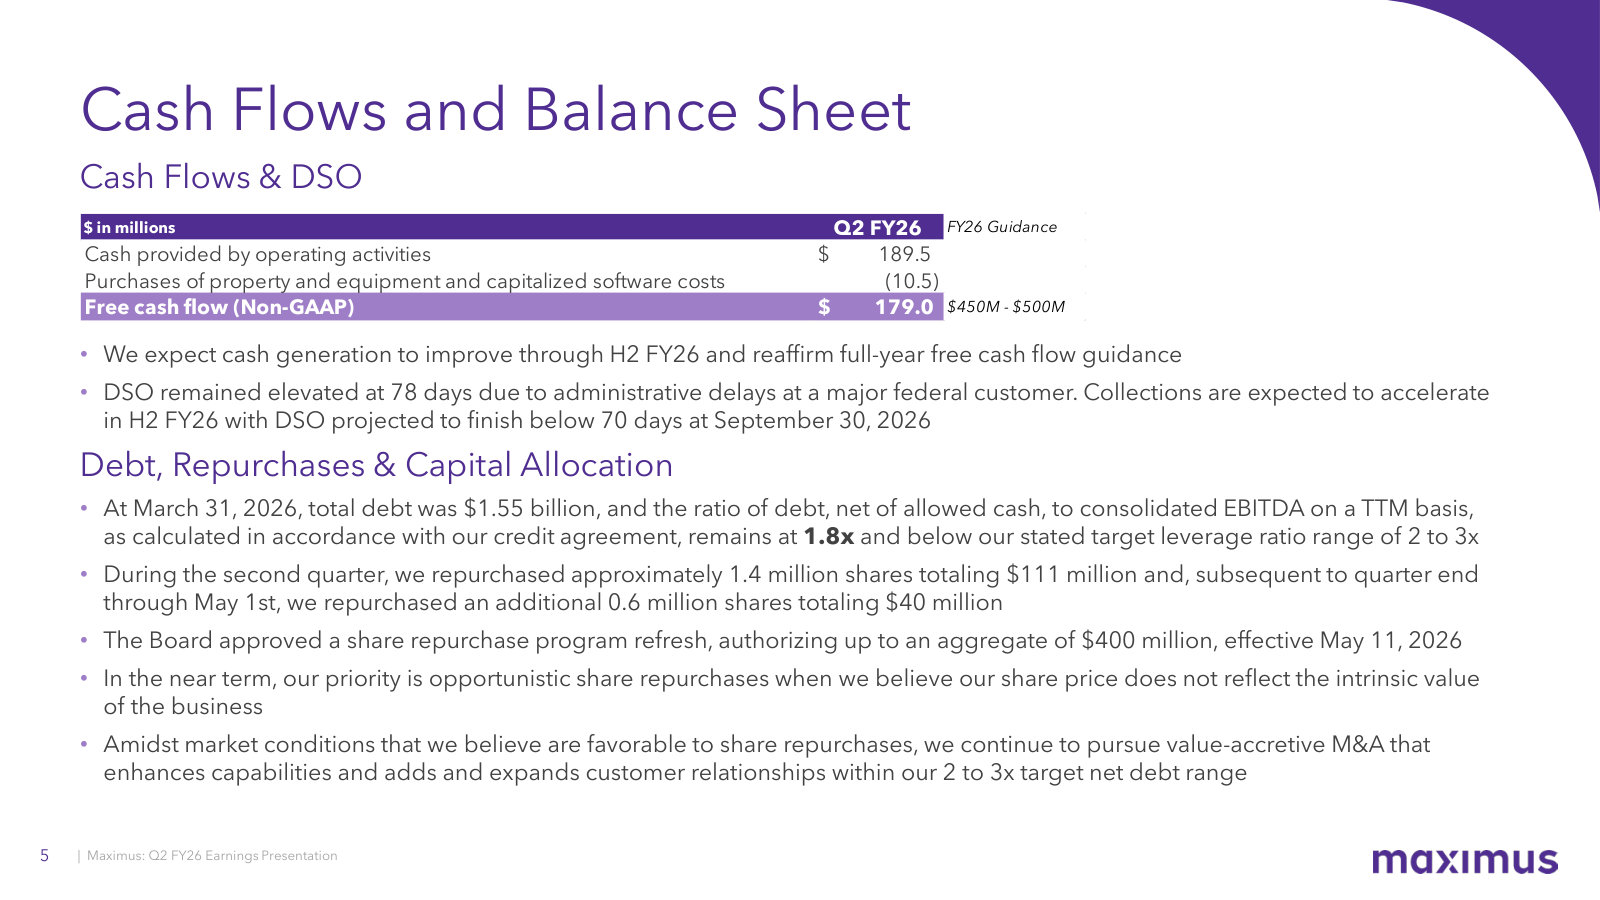
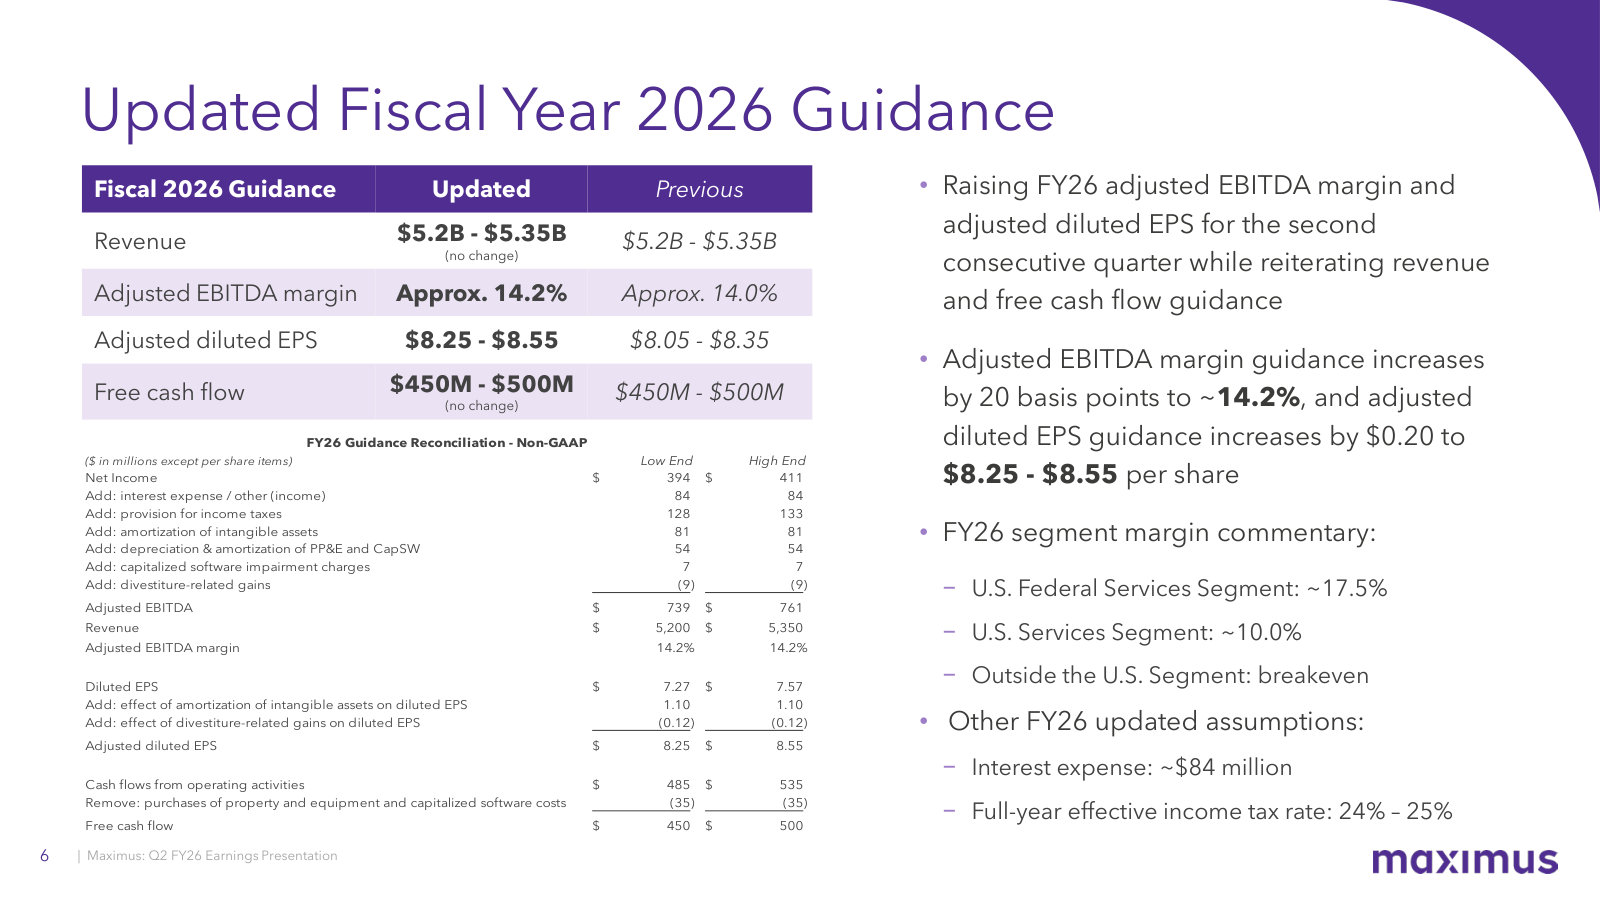
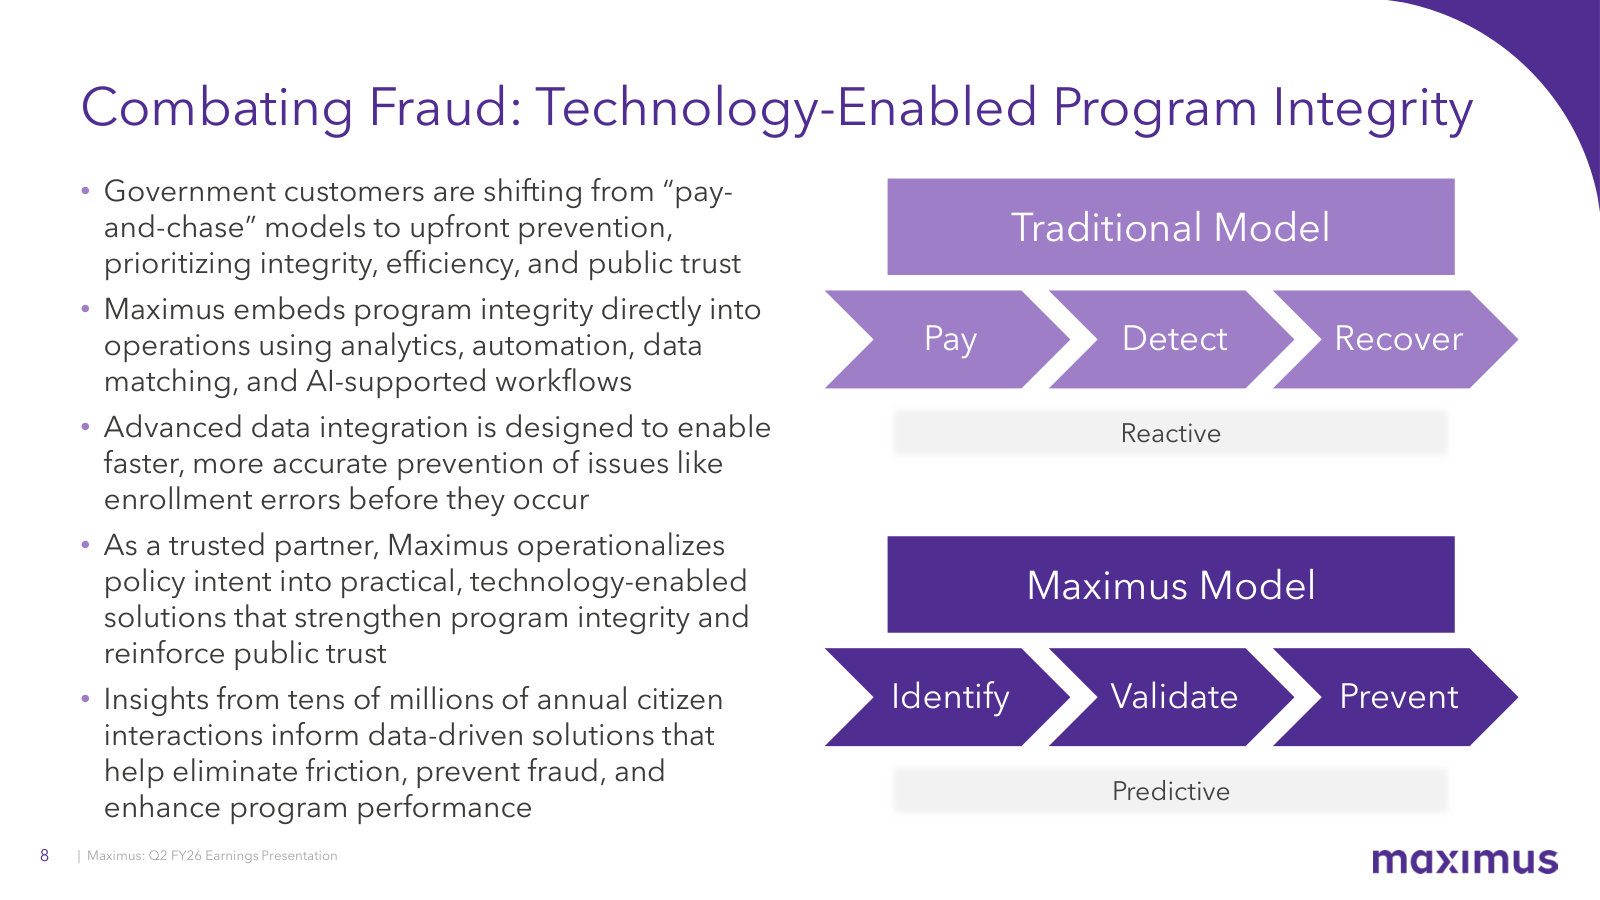
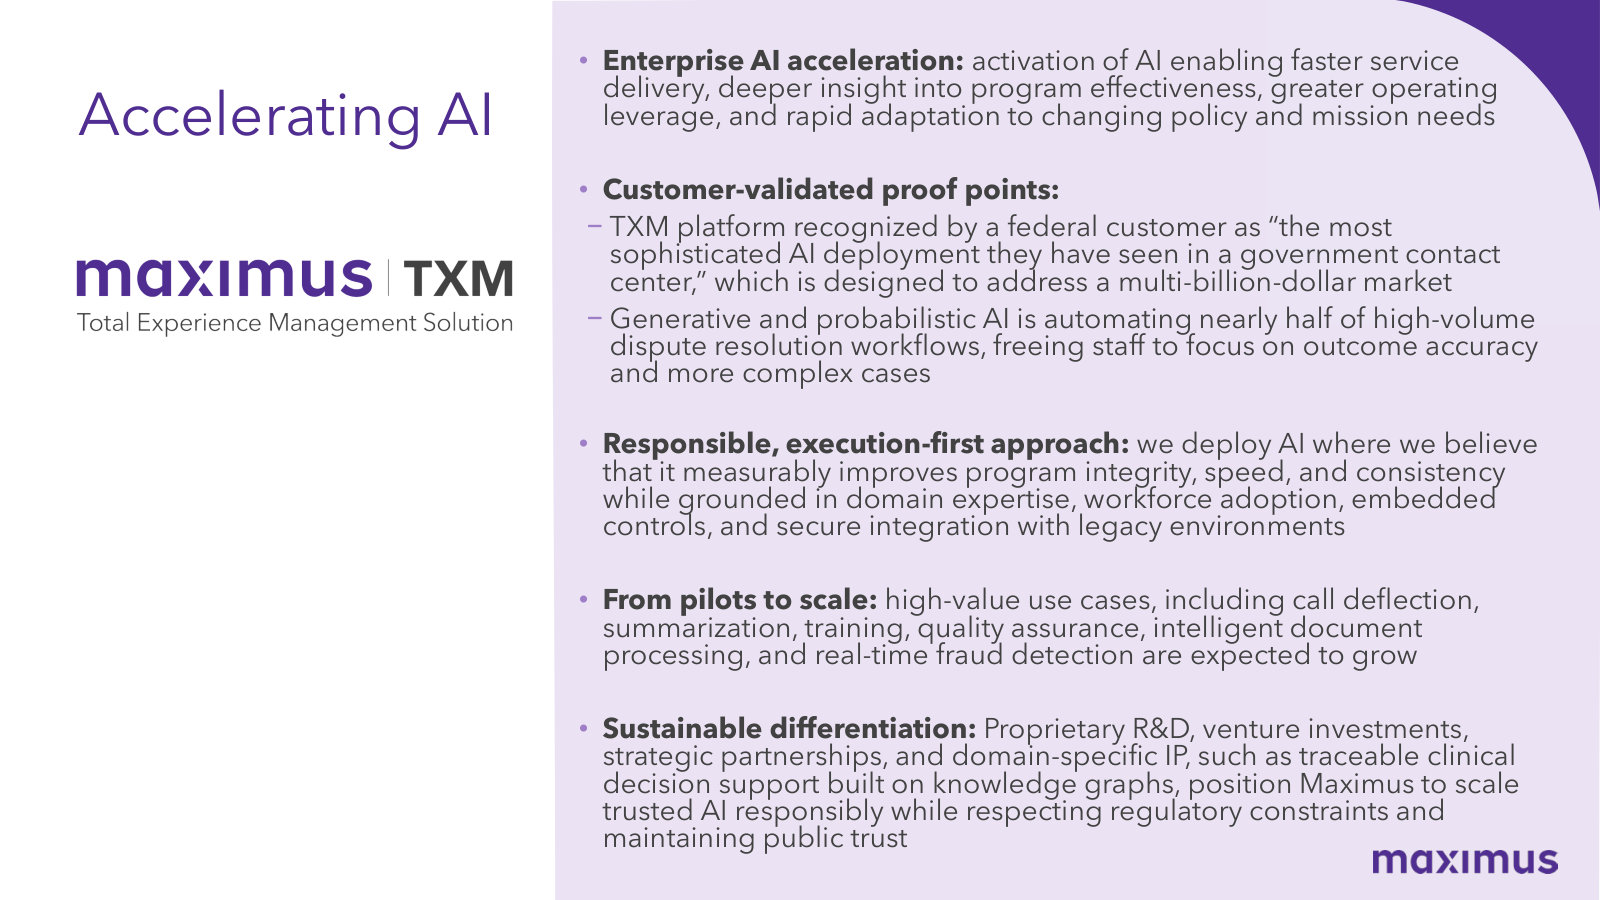
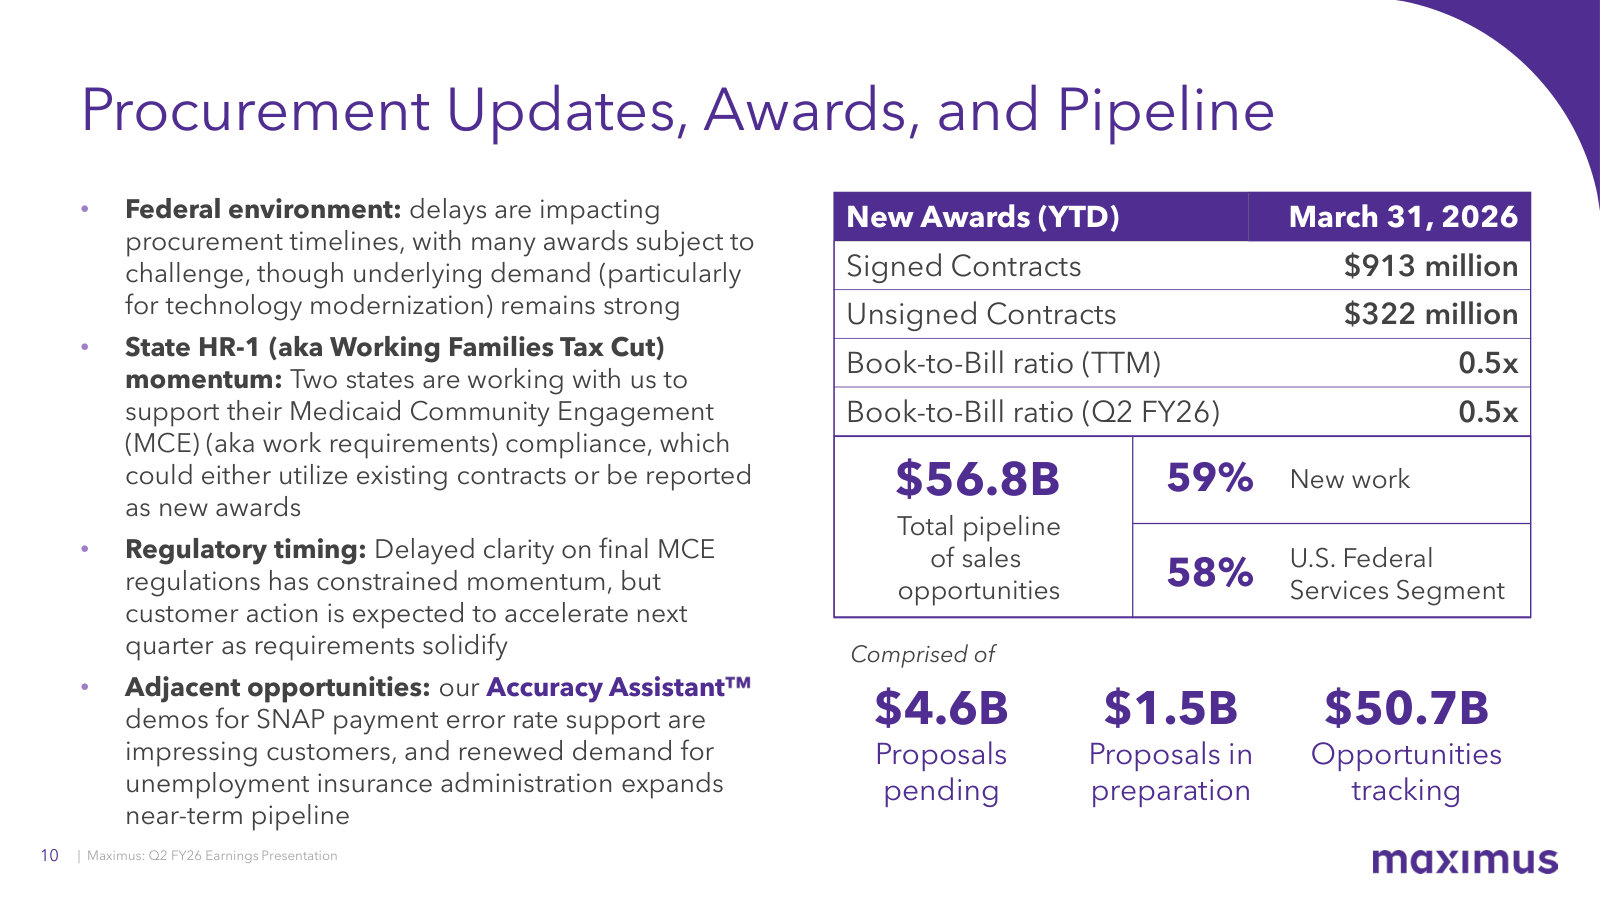
p. 3 — Q2 FY26 P&L: revenue down 4.1% on the absence of prior-year disaster work, but adjusted EBITDA margin up to 14.4% on automation. · Open the full presentation →p. 4 — Segment detail — Federal at 17.6% margin, U.S. Services at 9.3% after an impairment, Outside the U.S. back to a loss. · Open the full presentation →p. 5 — Cash flow, the elevated 78-day DSO at a major federal customer, and the refreshed $400M buyback authorization. · Open the full presentation →p. 6 — FY26 guidance raised a second time on margin and EPS with revenue held flat, plus segment margin assumptions and the non-GAAP bridge. · Open the full presentation →p. 8 — Program integrity reframed: the shift from "pay-detect-recover" to "identify-validate-prevent," and why that shift is a revenue opportunity. · Open the full presentation →p. 9 — The AI case in management's own words: TXM proof points, near-half automation of dispute workflows, and the claimed moat. · Open the full presentation →p. 10 — Book-to-bill at 0.5x against a $56.8B pipeline, with procurement delays and H.R.1 timing named as the reasons awards are slow. · Open the full presentation →
The full-year scorecard and FY26 setup: a complete year of segment economics and the priorities set for the year now underway. · Open the full document →
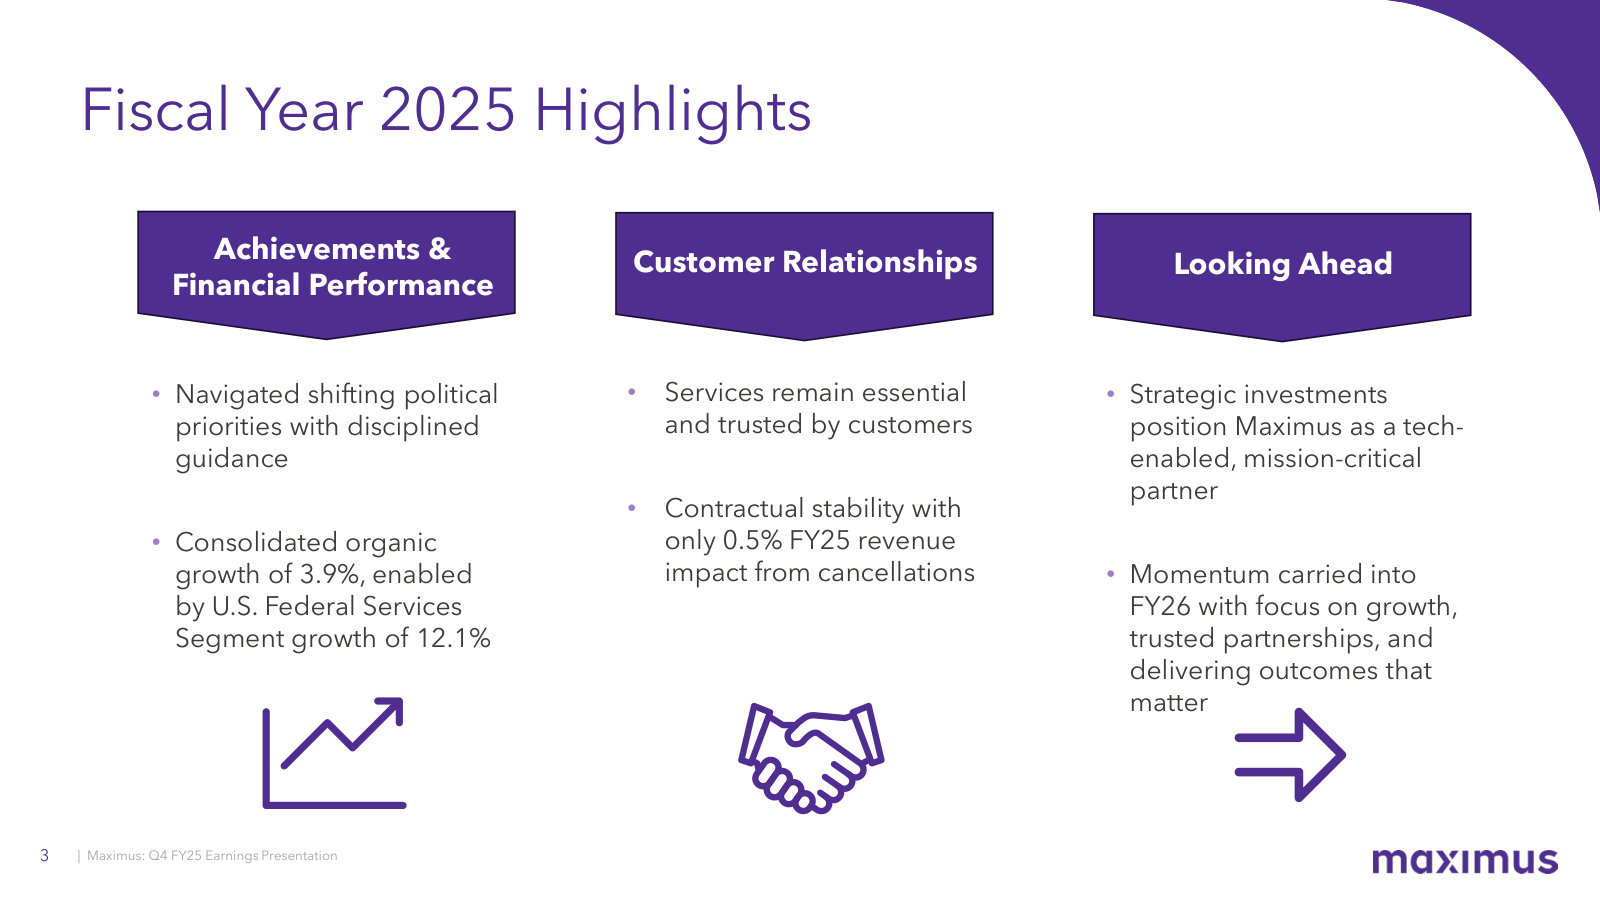
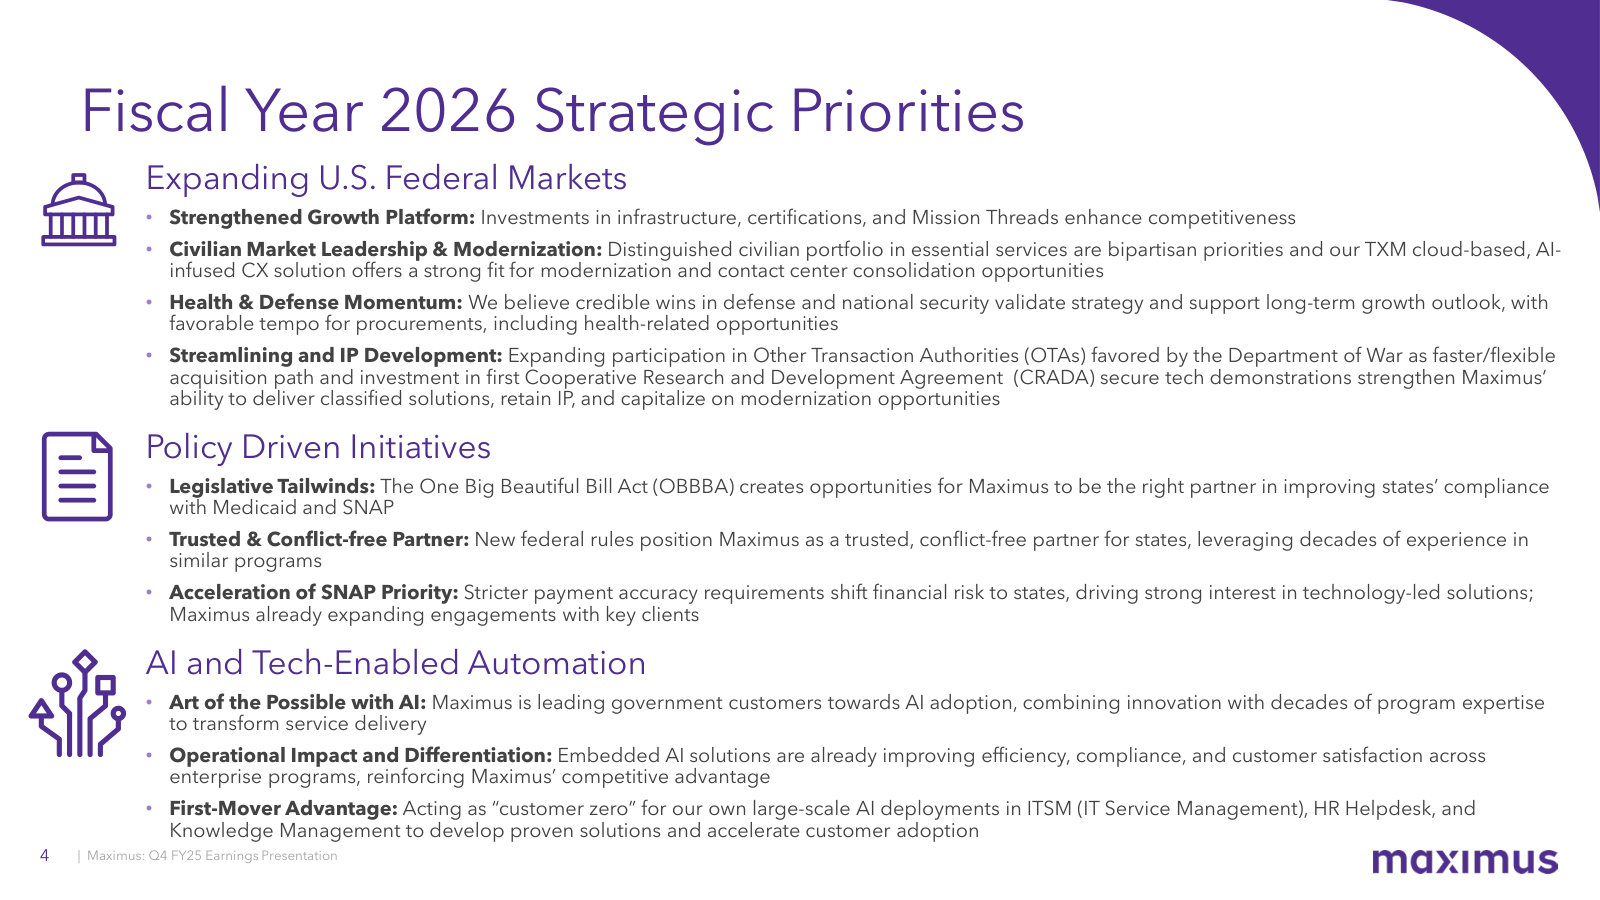
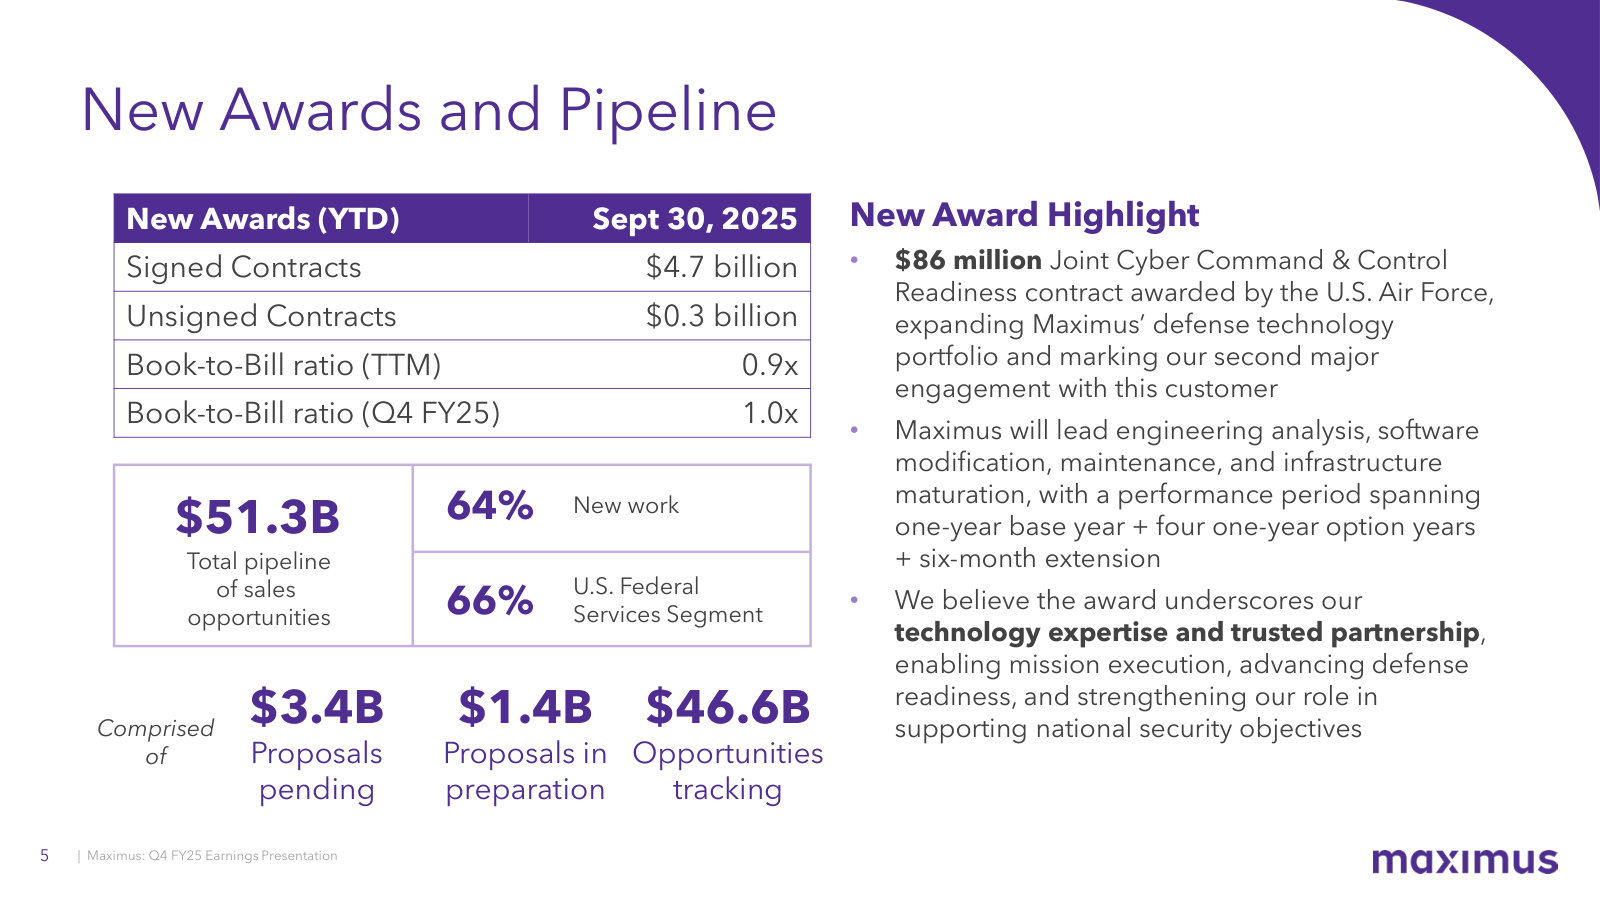
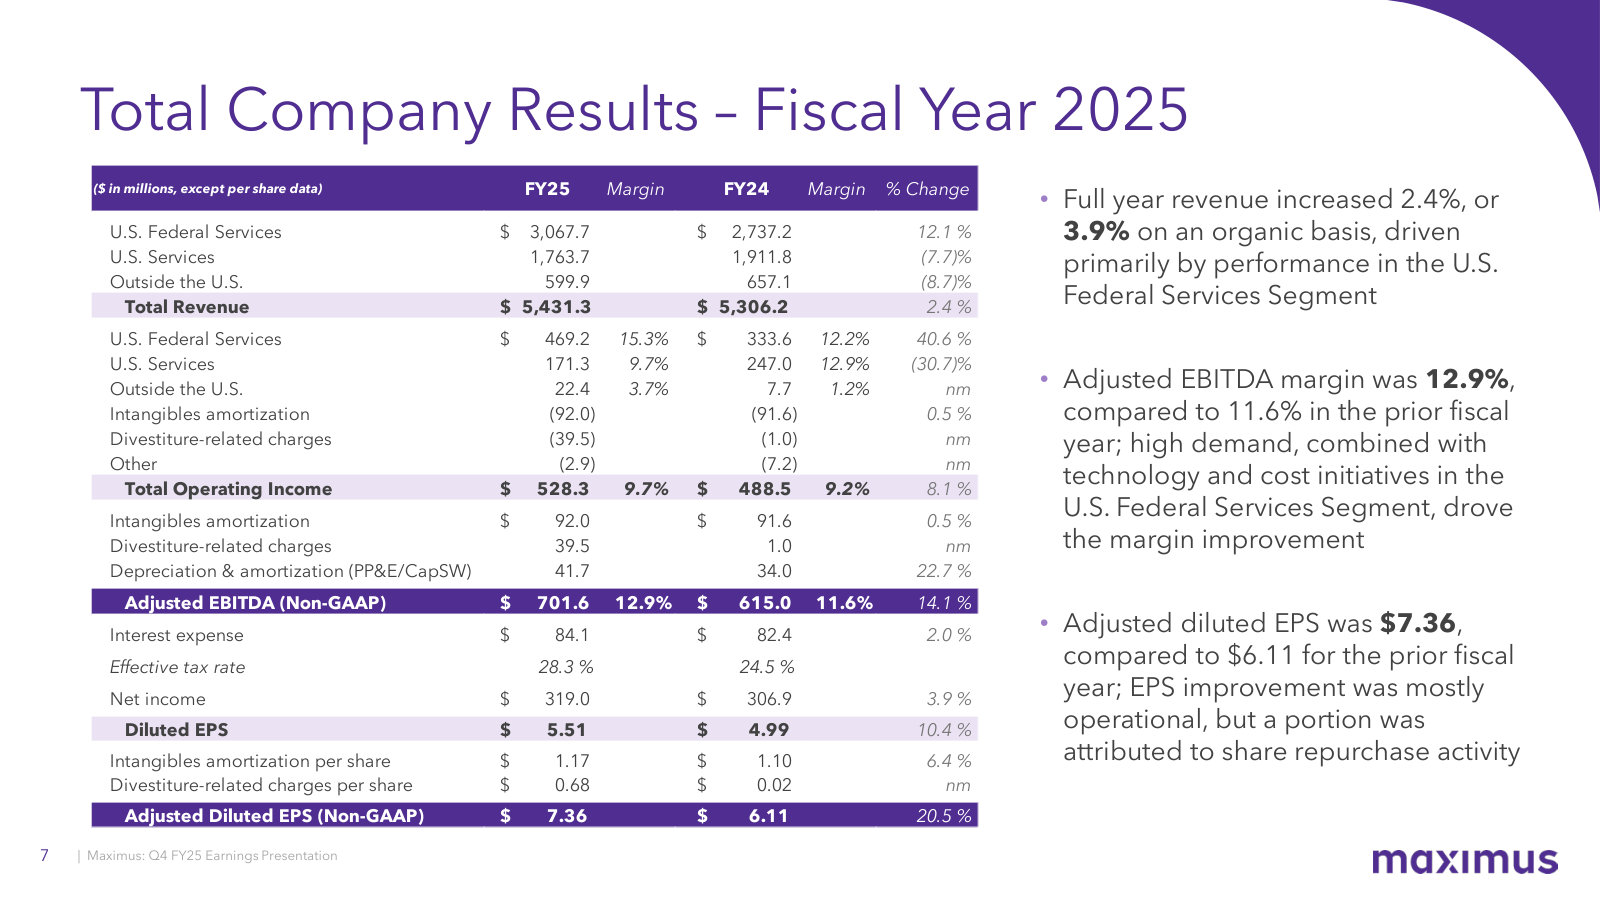
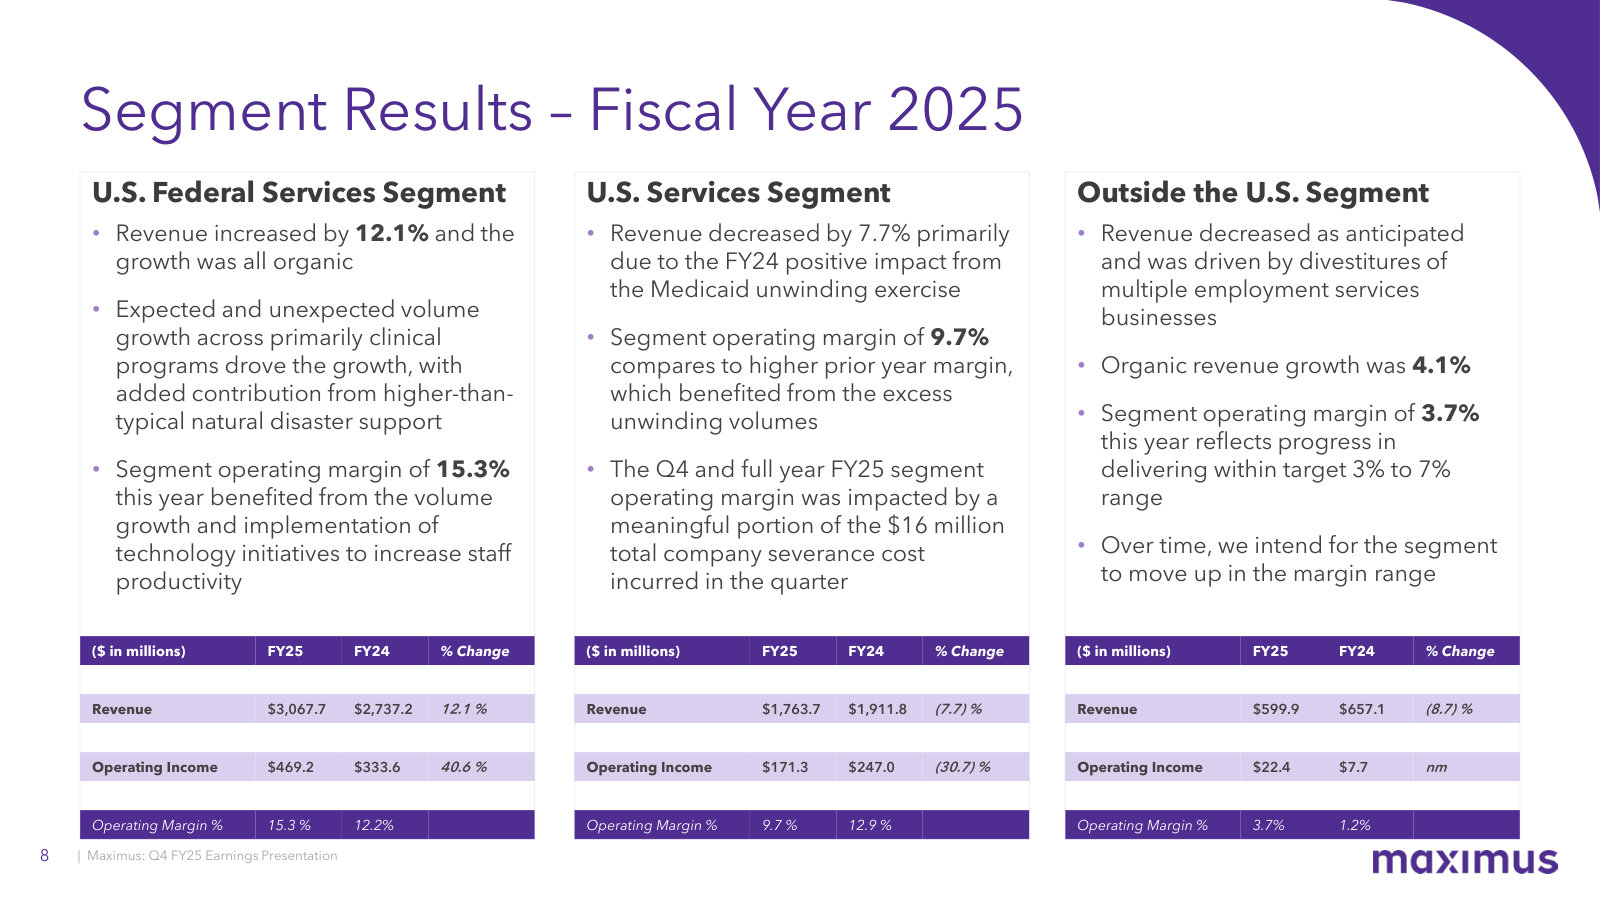
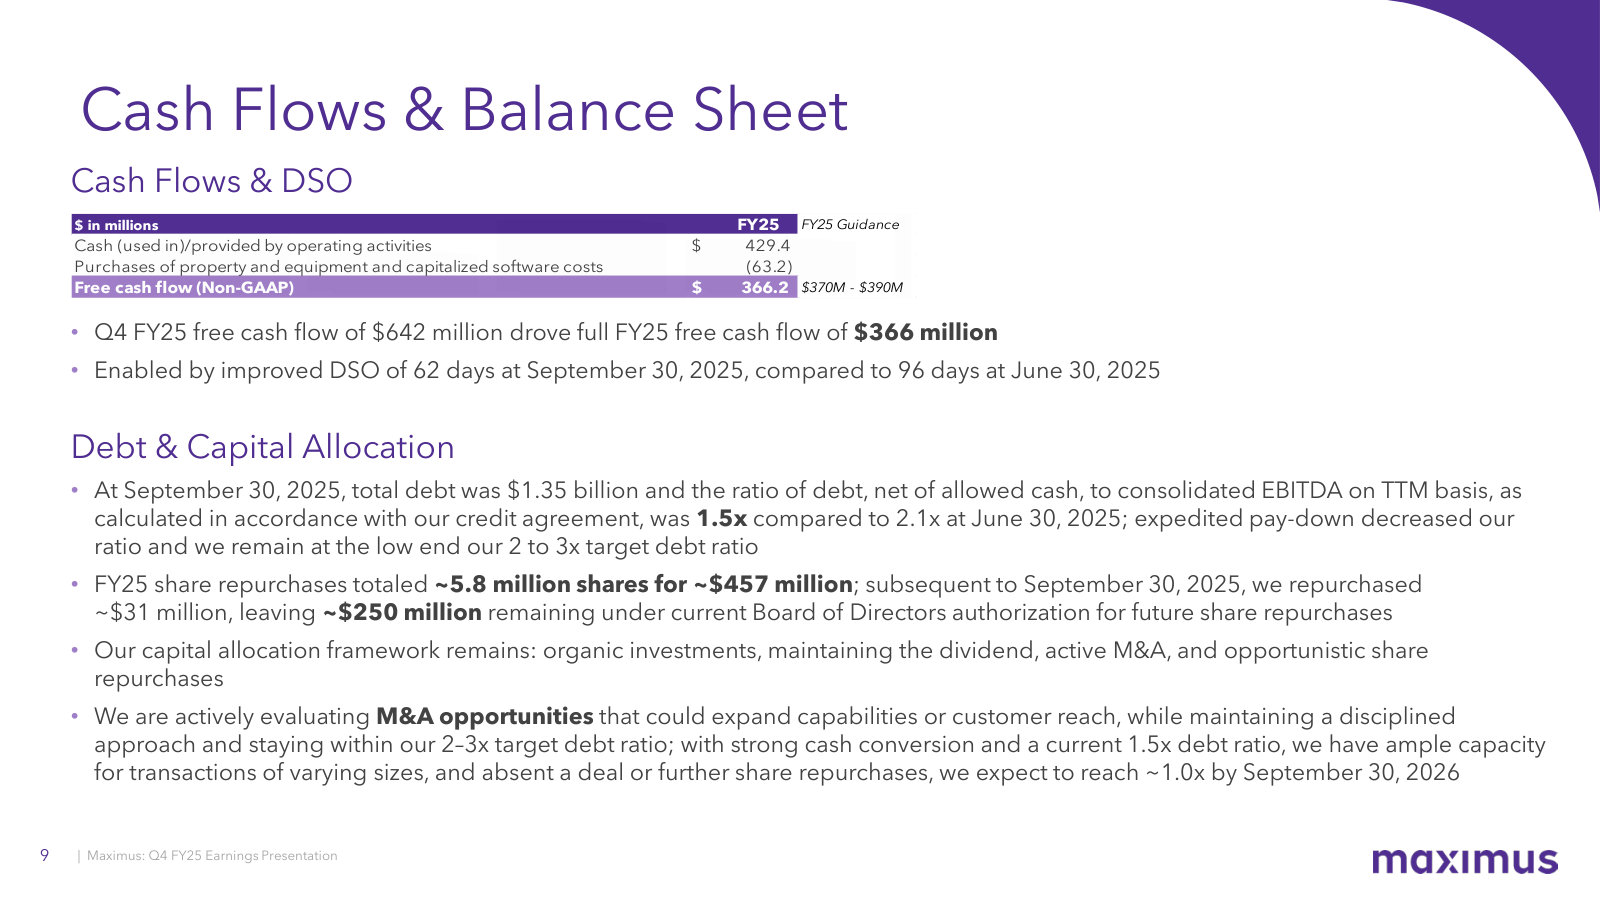
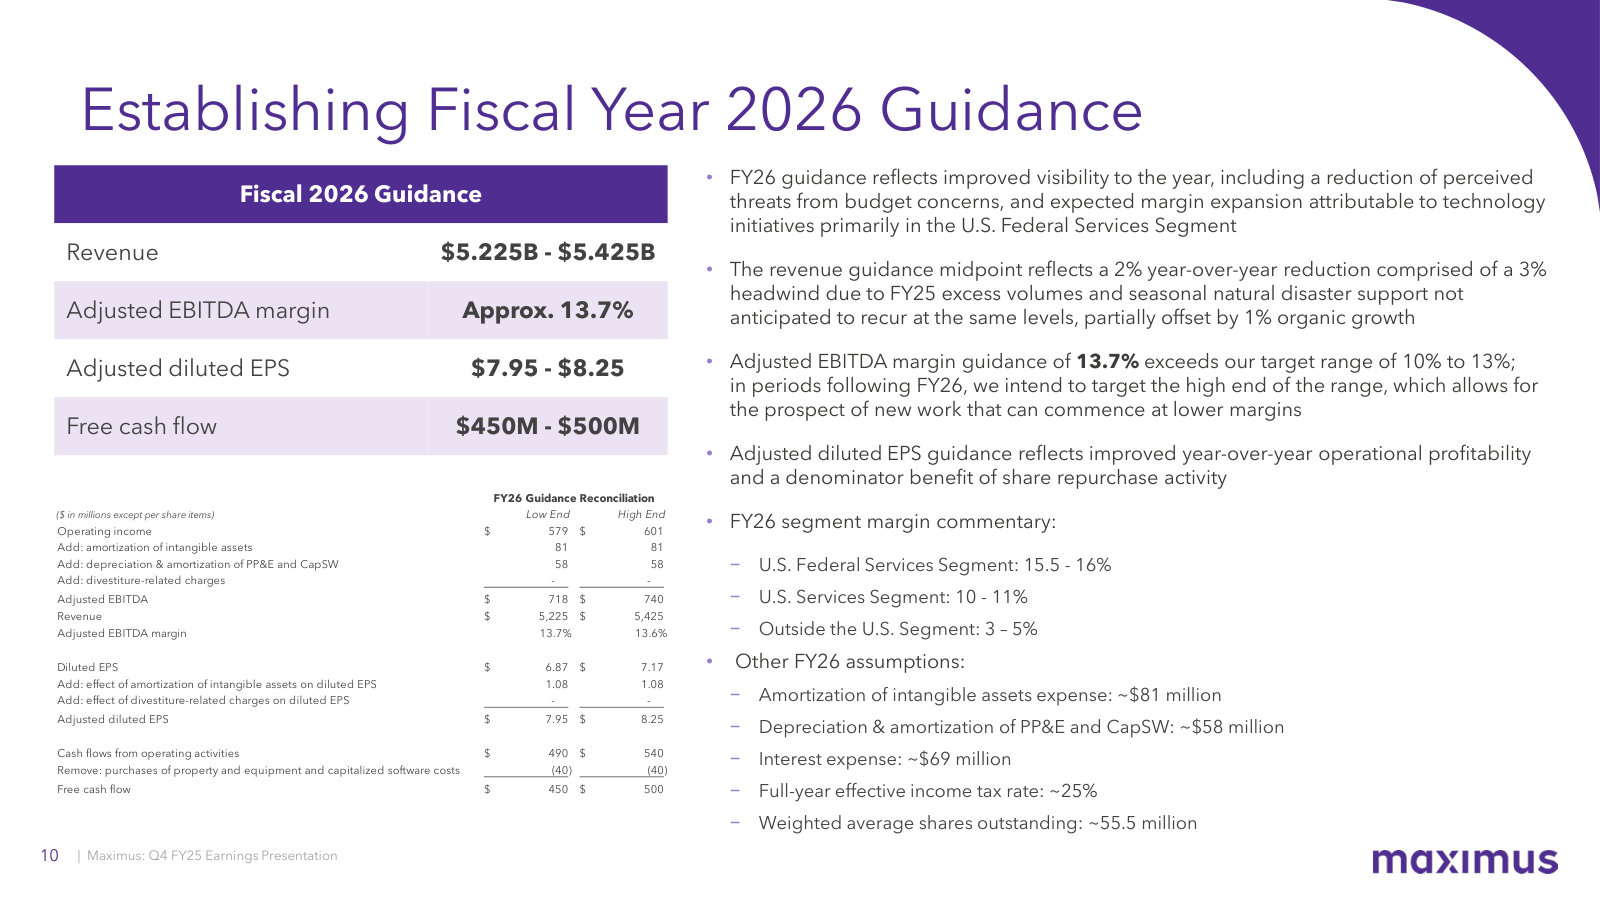
p. 3 — FY25 in three panels, with the durability claim that matters: only 0.5% of revenue hit by cancellations amid federal cuts. · Open the full presentation →p. 4 — The FY26 priority list — federal market expansion, OBBBA-driven state work, and AI automation — laid out with the reasoning behind each. · Open the full presentation →p. 5 — FY25 awards and the $51.3B pipeline, plus the Air Force cyber contract that marks the push into defense. · Open the full presentation →p. 7 — Full-year FY25 results: 3.9% organic growth, adjusted EBITDA margin up 130bps to 12.9%, adjusted EPS $7.36. · Open the full presentation →p. 8 — Segment results for the full year — Federal up 12.1% with margin at 15.3%, U.S. Services down on the Medicaid unwinding comparison. · Open the full presentation →p. 9 — FY25 cash flow and the balance sheet: $366M free cash flow, DSO down to 62 days, $457M of buybacks, leverage at 1.5x. · Open the full presentation →p. 10 — Initial FY26 guidance with the segment margin assumptions and the explanation for the 2% revenue step-down at the midpoint. · Open the full presentation →
Fiscal 2026 First Quarter Earnings Call — Q1 FY2026 · 11 pages · The GSA contact-center BPA single award, and the first framing of how states will use Maximus under H.R.1. · Open →
Fiscal 2025 Third Quarter Earnings Call — Q3 FY2025 · 12 pages · Where the FY26 outlook started, and the OPM guidance change that reopened state contracting. · Open →
Fiscal 2025 Second Quarter Earnings Call — Q2 FY2025 · 18 pages · Management's answer to the DOGE question, and the case that the VES acquisition worked. · Open →
Fiscal 2025 First Quarter Earnings Call — Q1 FY2025 · 16 pages · The exit from Australian and South Korean employment services, and how Medicaid policy risk was framed at the time. · Open →
Fiscal 2024 Year End Earnings Call — FY2024 · 16 pages · The FY24 base year and the original FY25 guidance, useful for judging what actually got delivered. · Open →
Fiscal 2024 Third Quarter Earnings Call — Q3 FY2024 · 15 pages · Management's pre-election view of how a change in administration would and would not affect the book. · Open →
Fiscal 2023 Year End Earnings Call — FY2023 · 17 pages · Where the current three-pillar strategy was first laid out, and the full cost of the 2023 cybersecurity incident. · Open →
Fiscal 2023 Third Quarter Earnings Call — Q3 FY2023 · 20 pages · The peak-volume quarter: Medicaid redeterminations and student loan return-to-repayment, the comparison base that still distorts growth. · Open →