Full Report
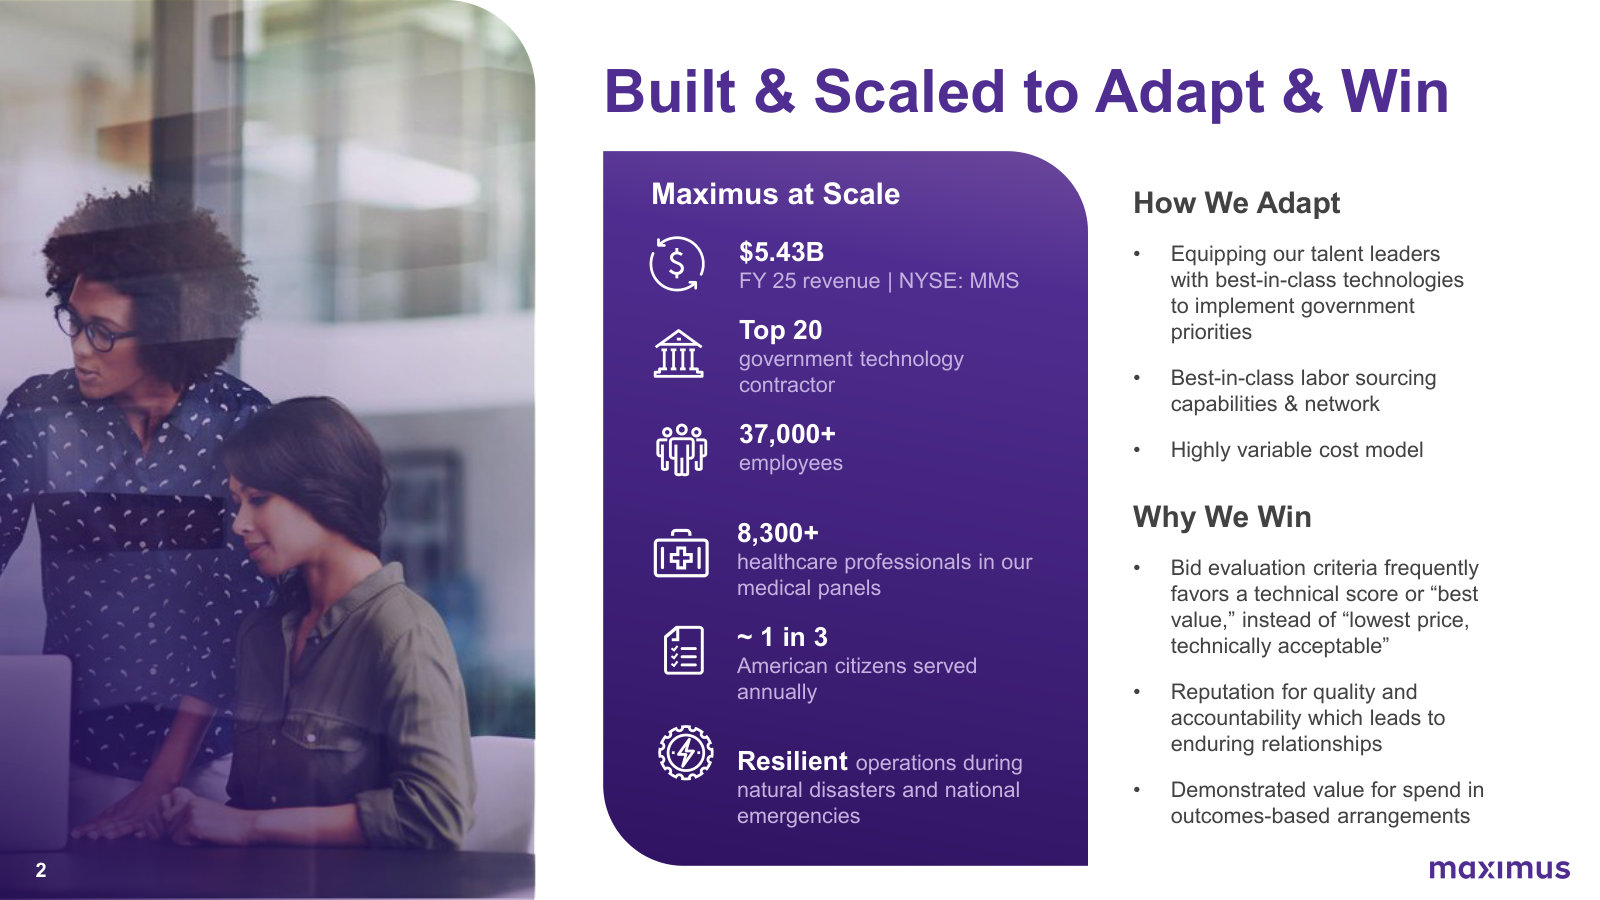
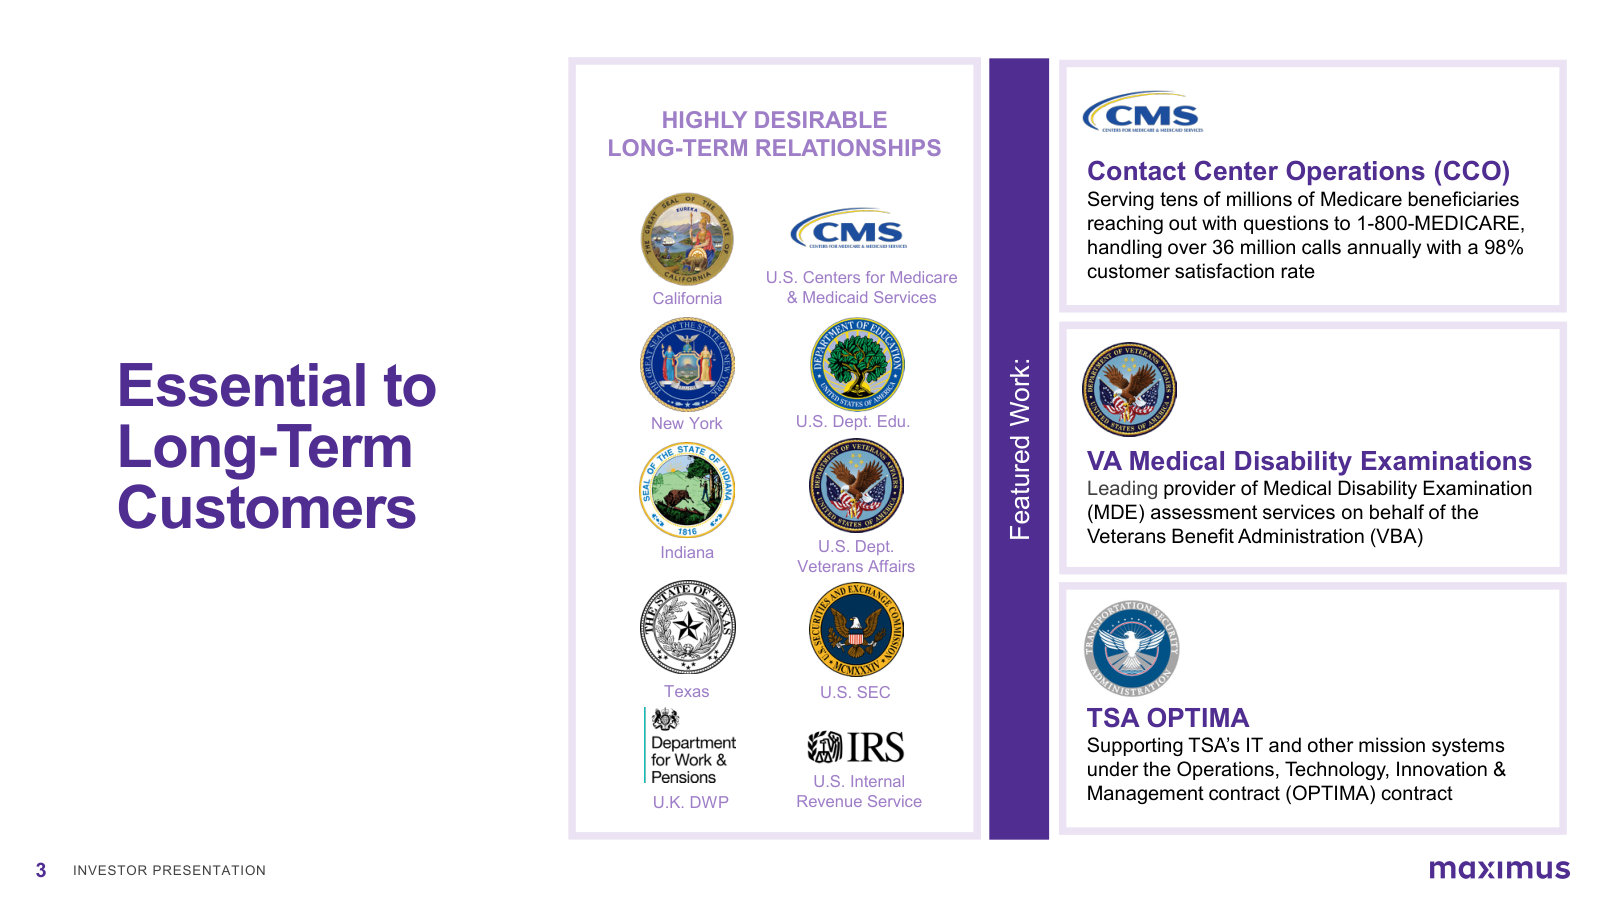
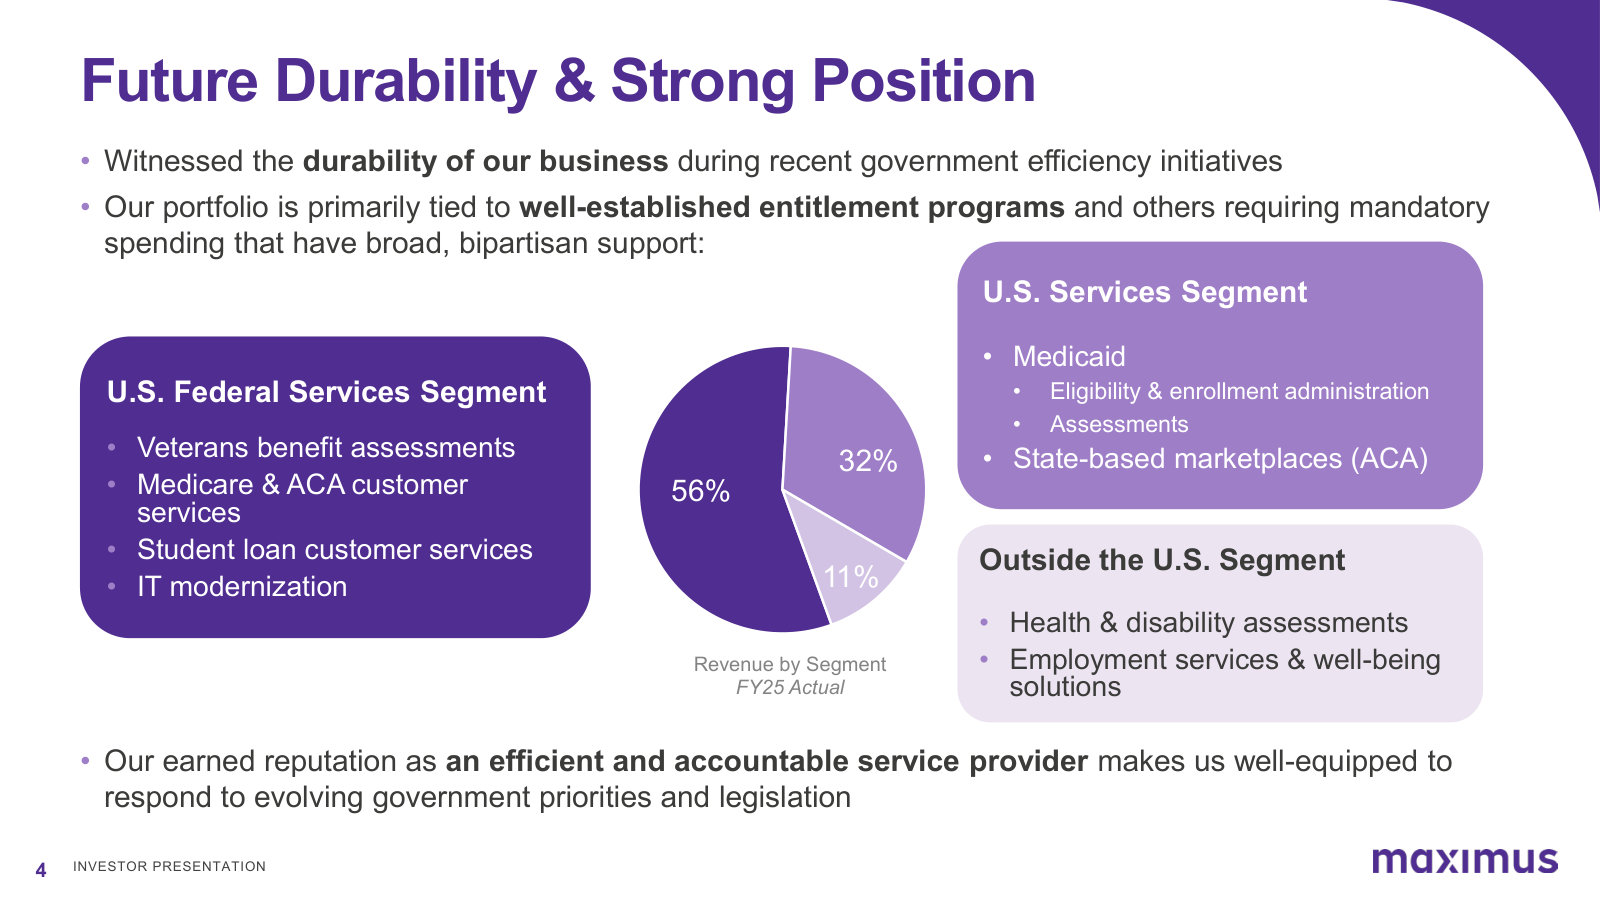
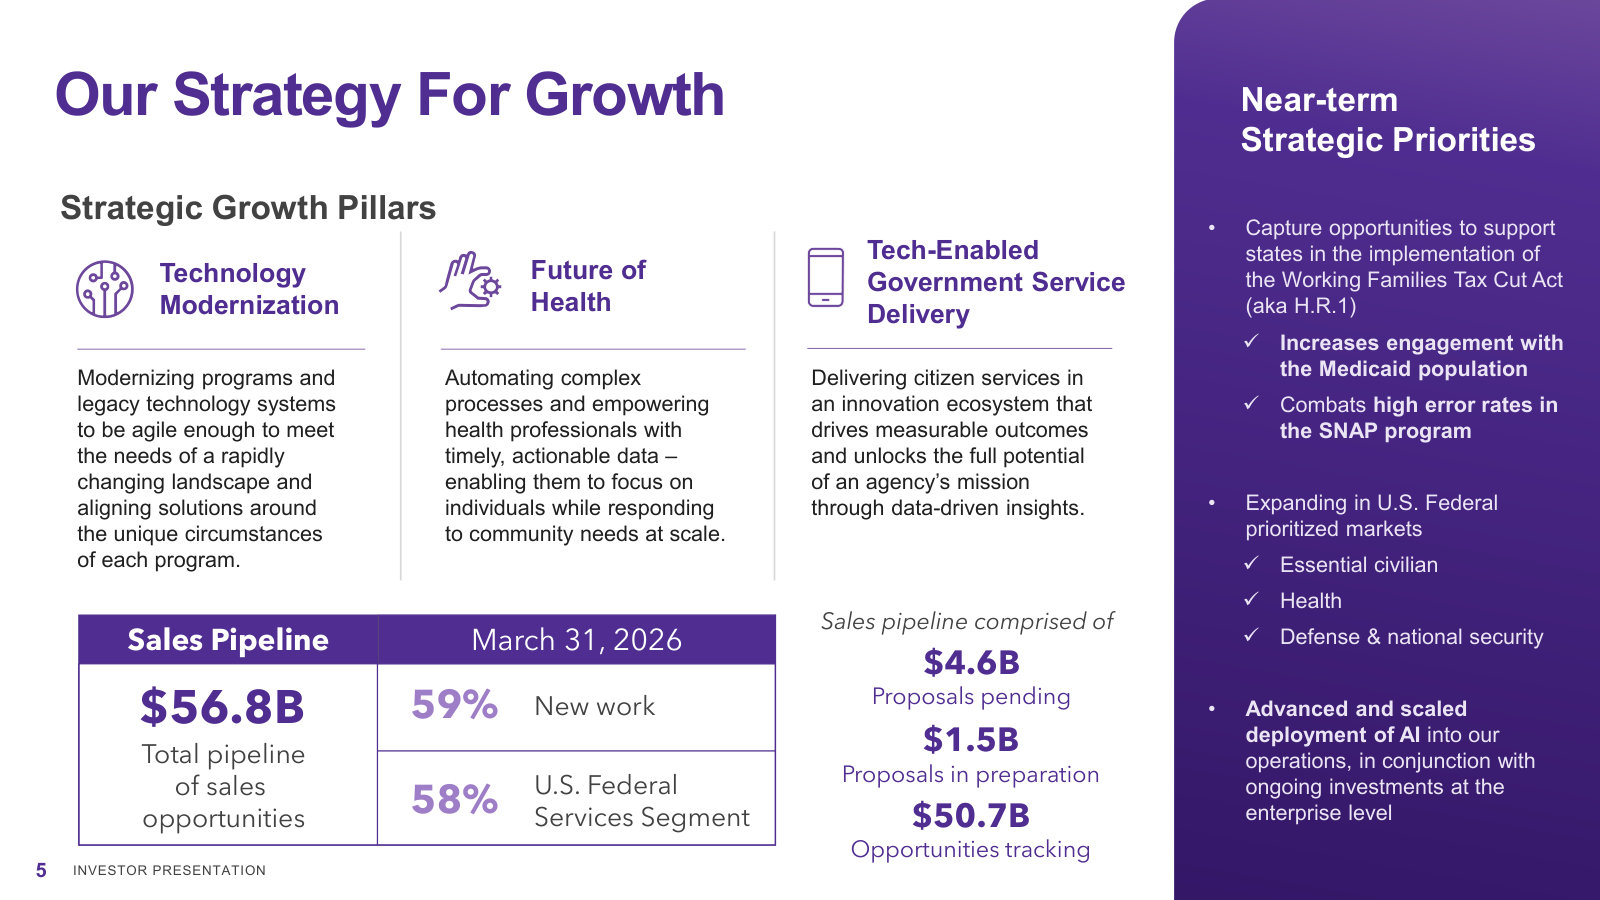
Maximus, Inc.'s management explains the business in its own materials. The slides below do the most of that work, pulled from the documents preserved in Sources. Each source link opens the complete presentation at that slide in a new tab.
Investor Presentation — June 2026
The standing company overview: what Maximus does for governments, the three segments, how contracts pay, and the financial model. · Open the full document →
Fiscal 2026 Second Quarter Earnings Call — Q2 FY2026
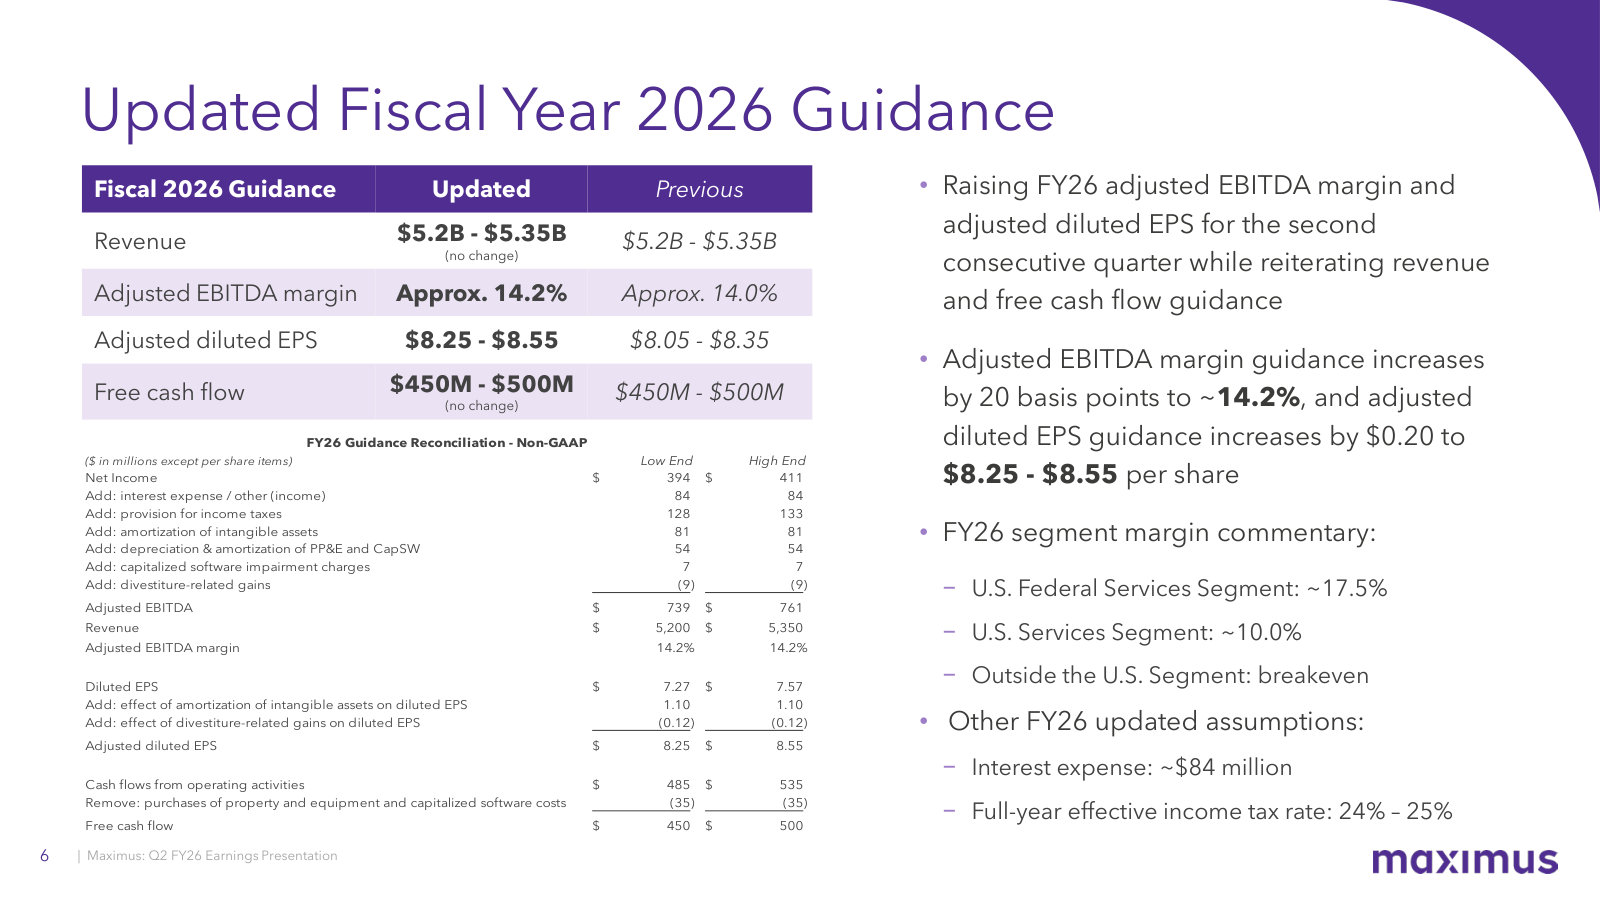
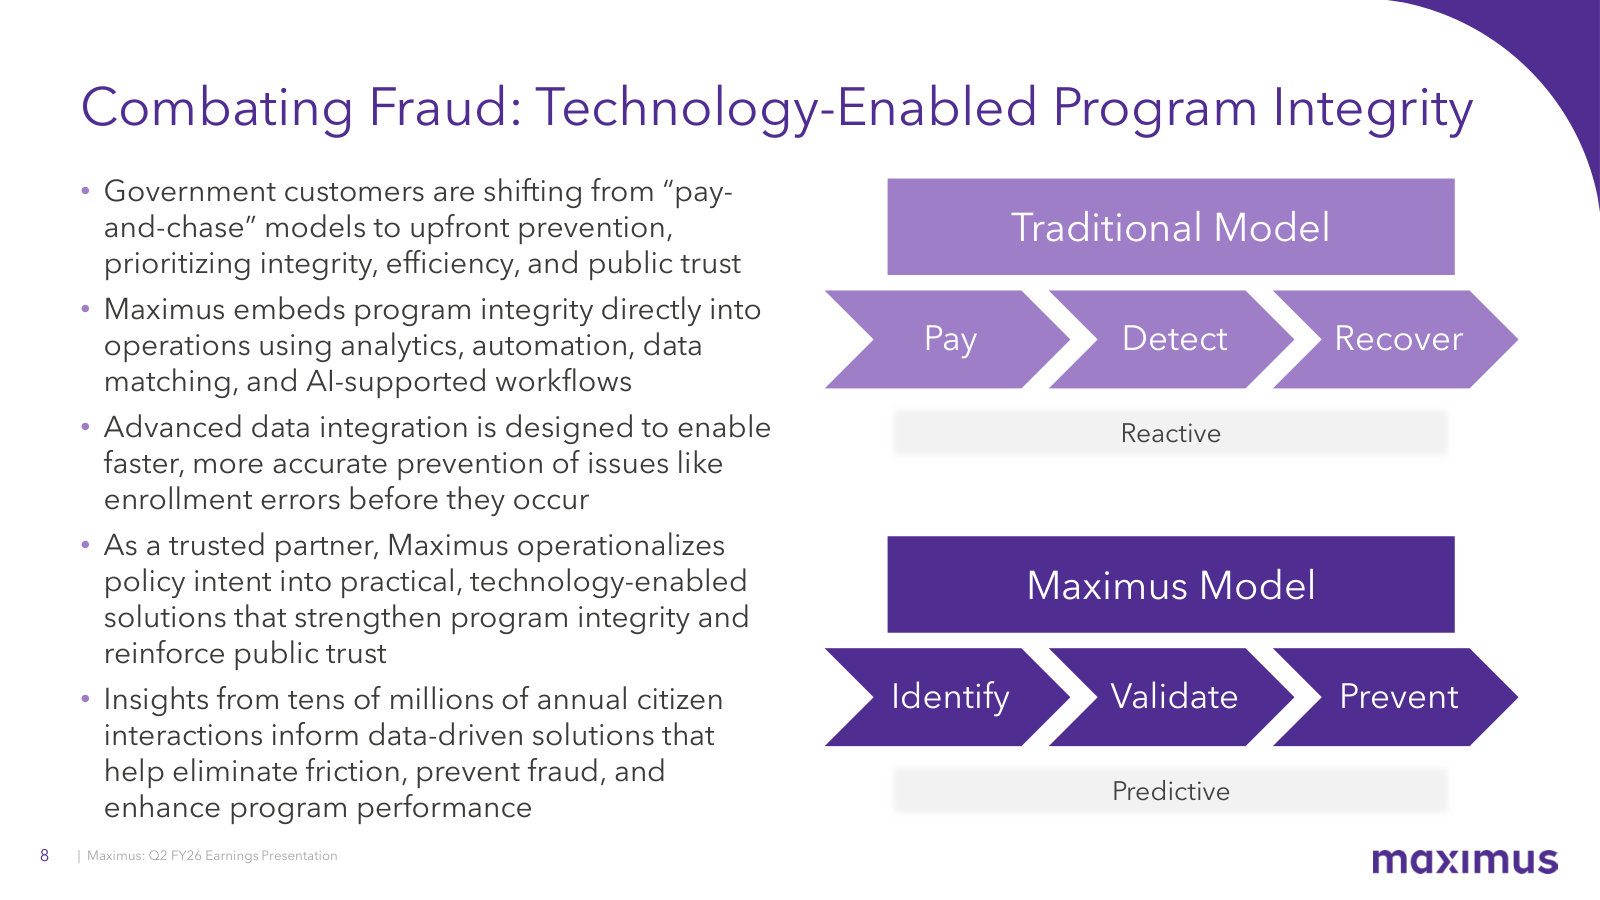
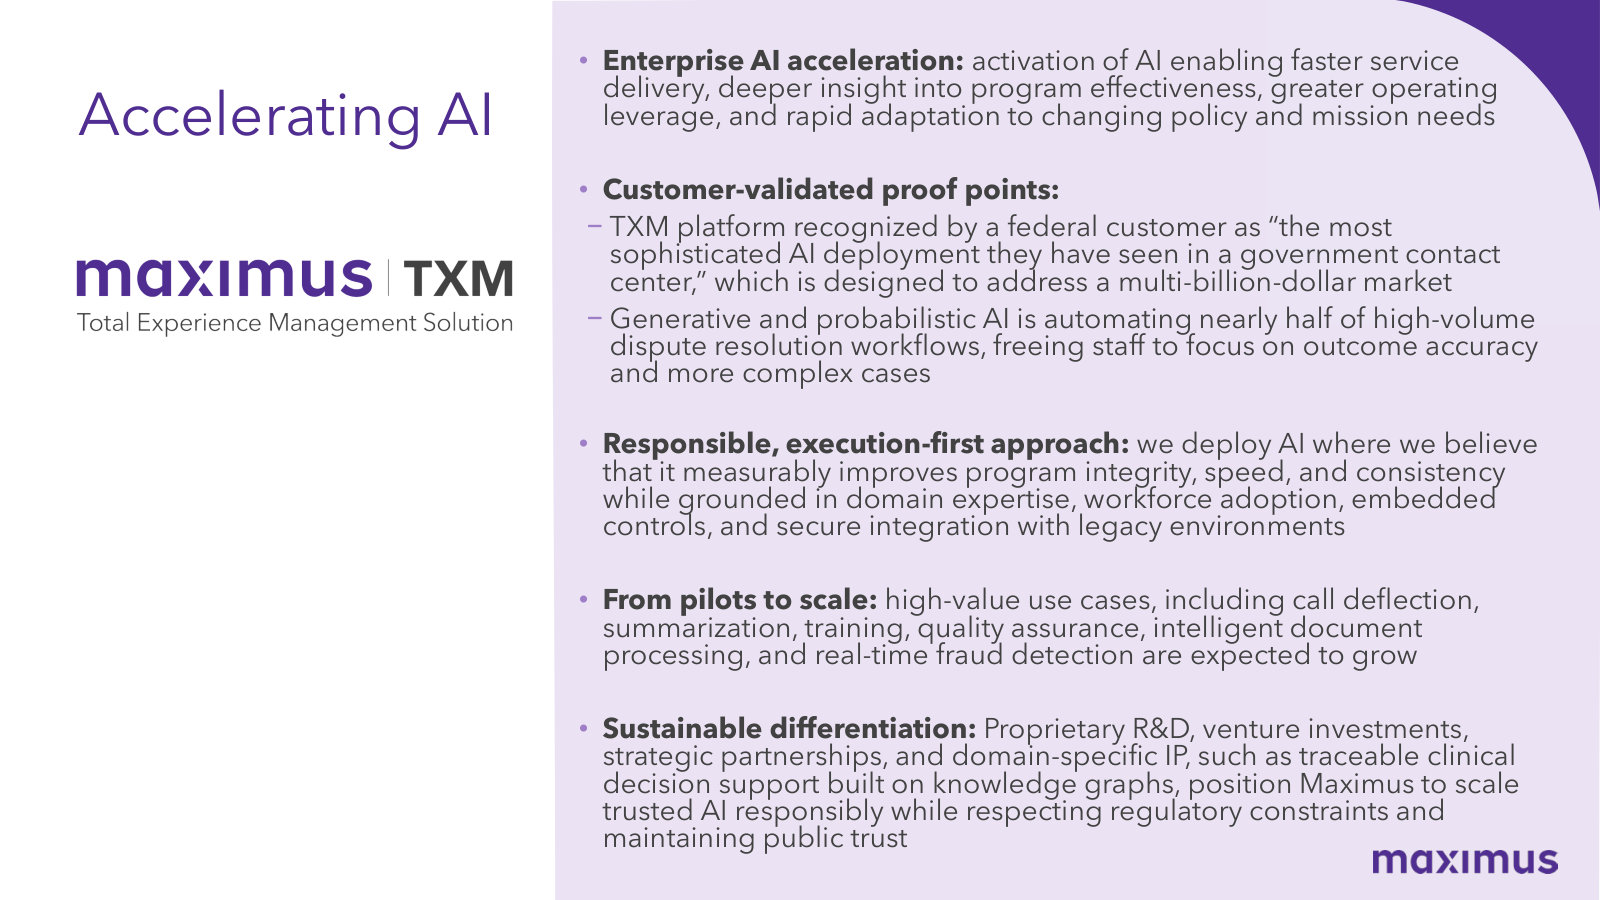
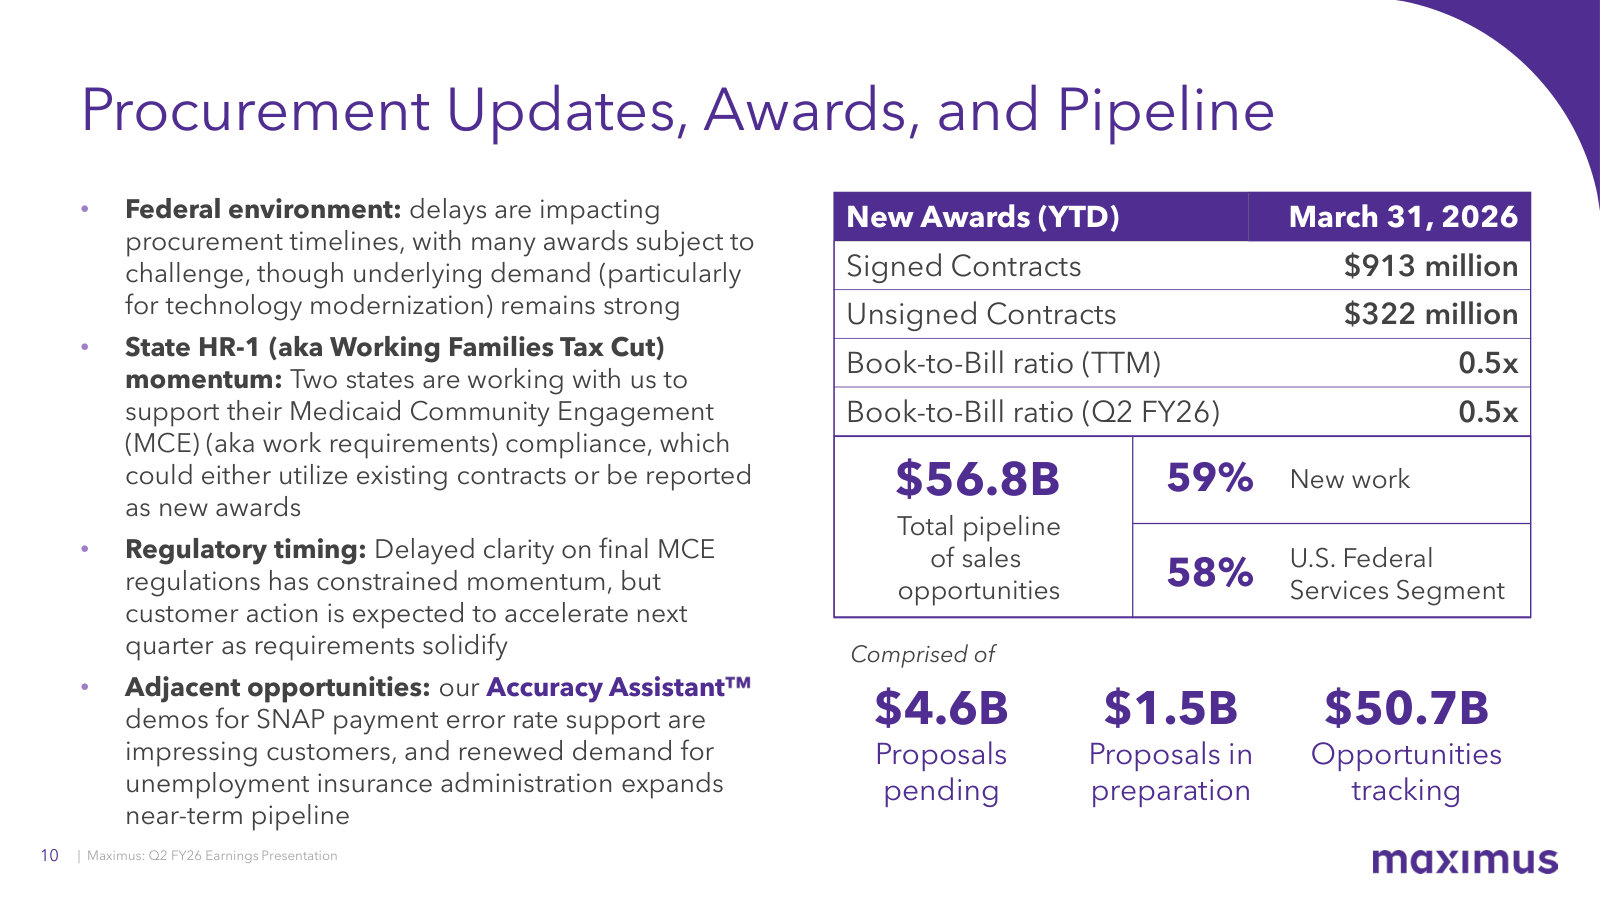
The latest quarter: current segment margins, raised FY26 guidance, and management's read on procurement delays and AI. · Open the full document →
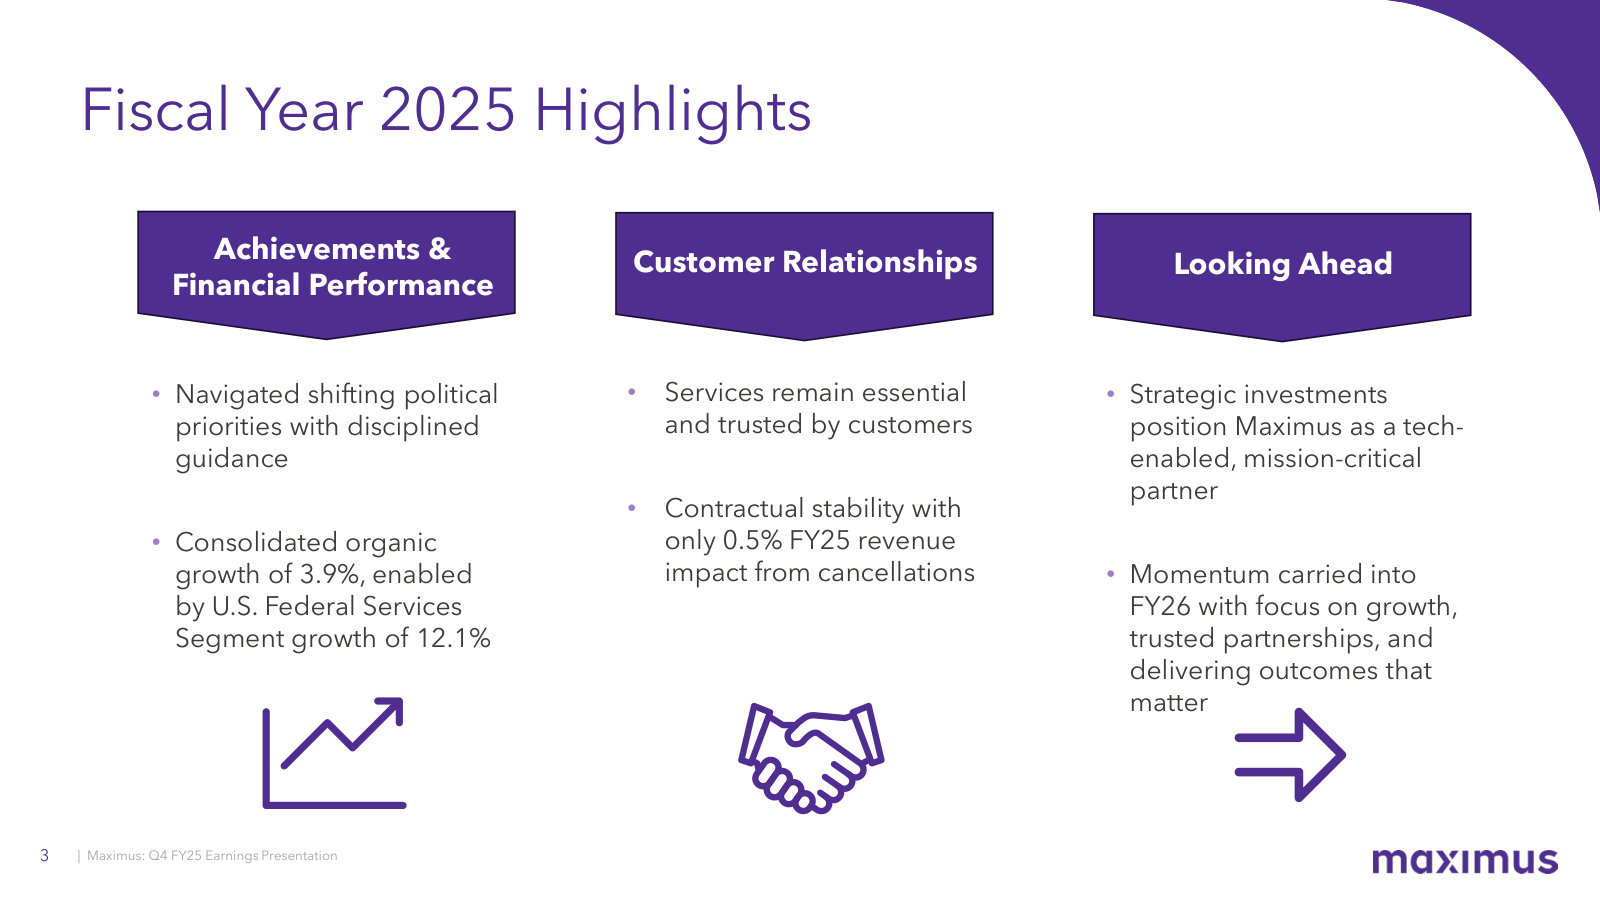
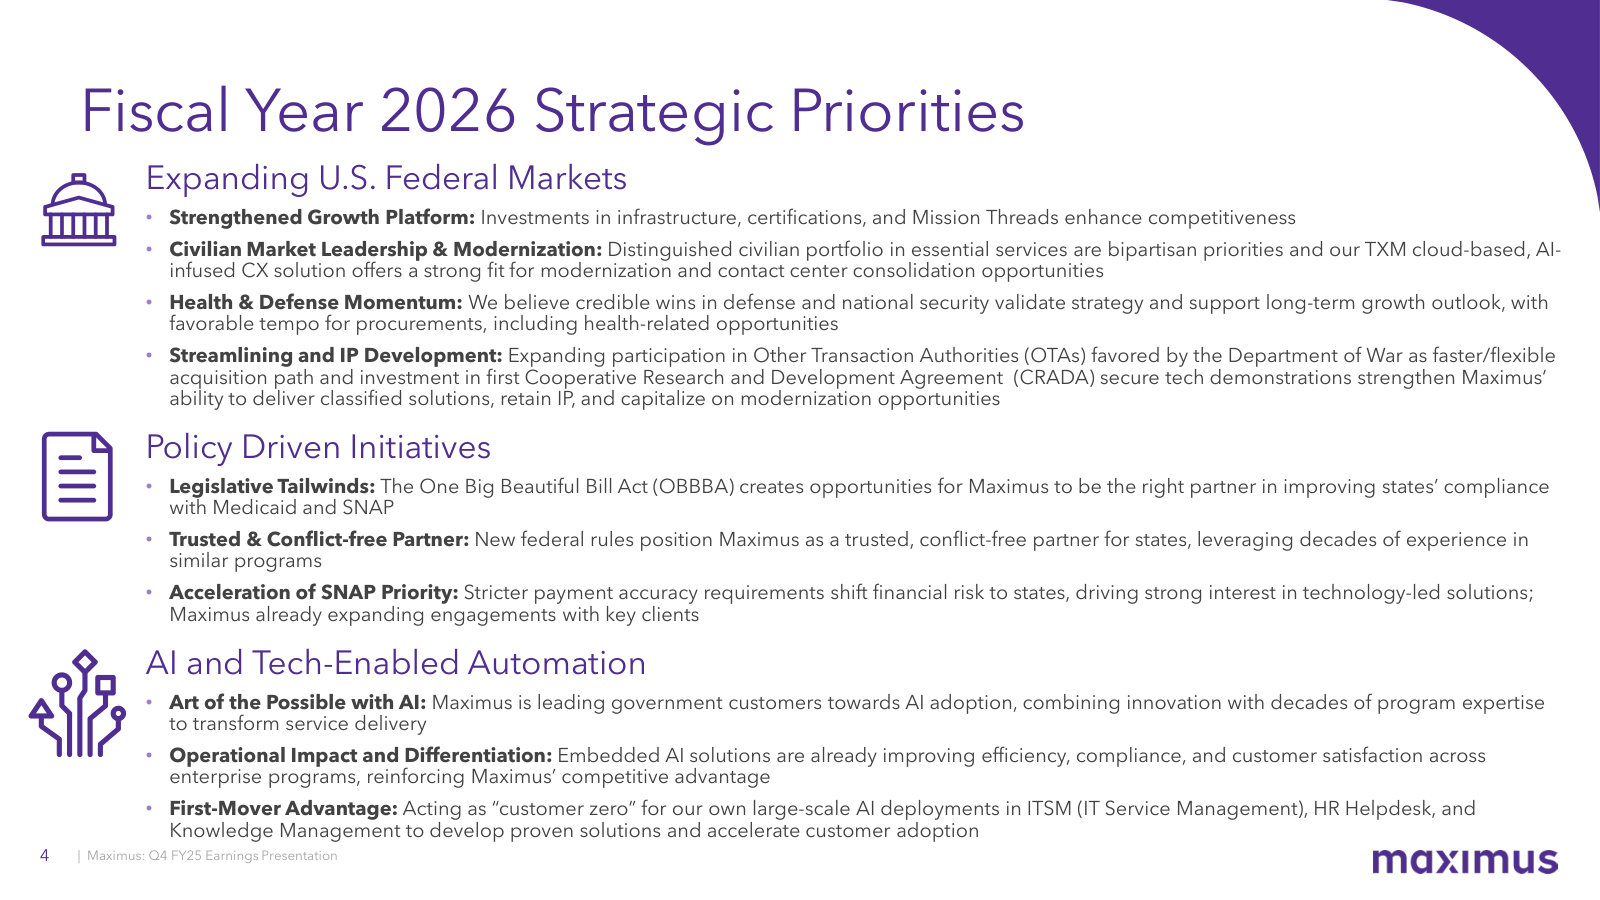
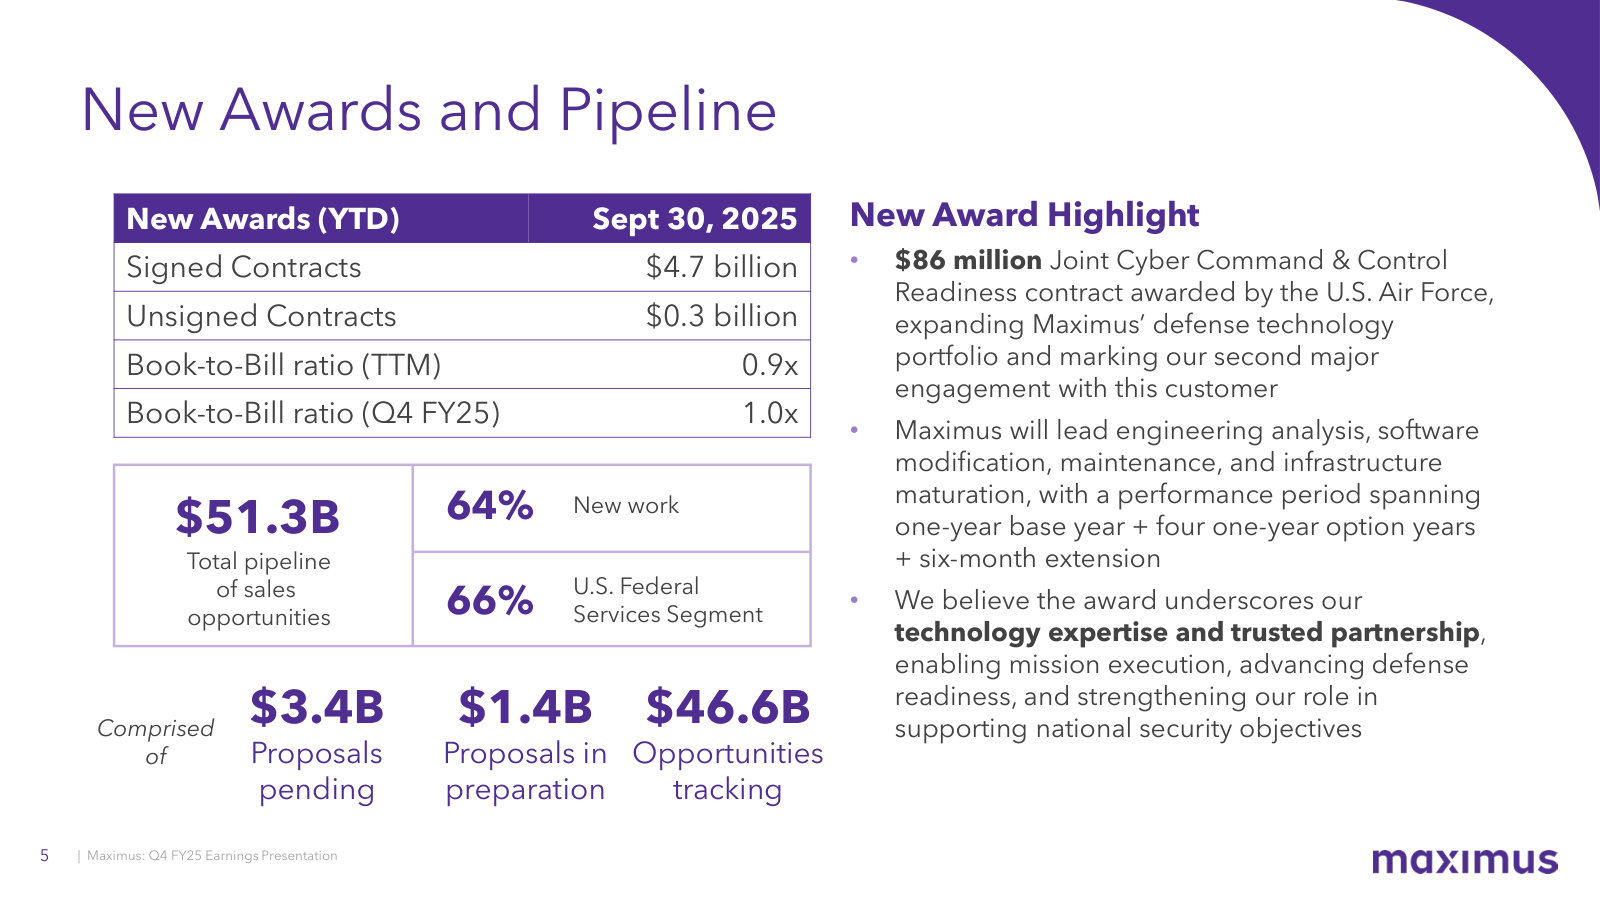
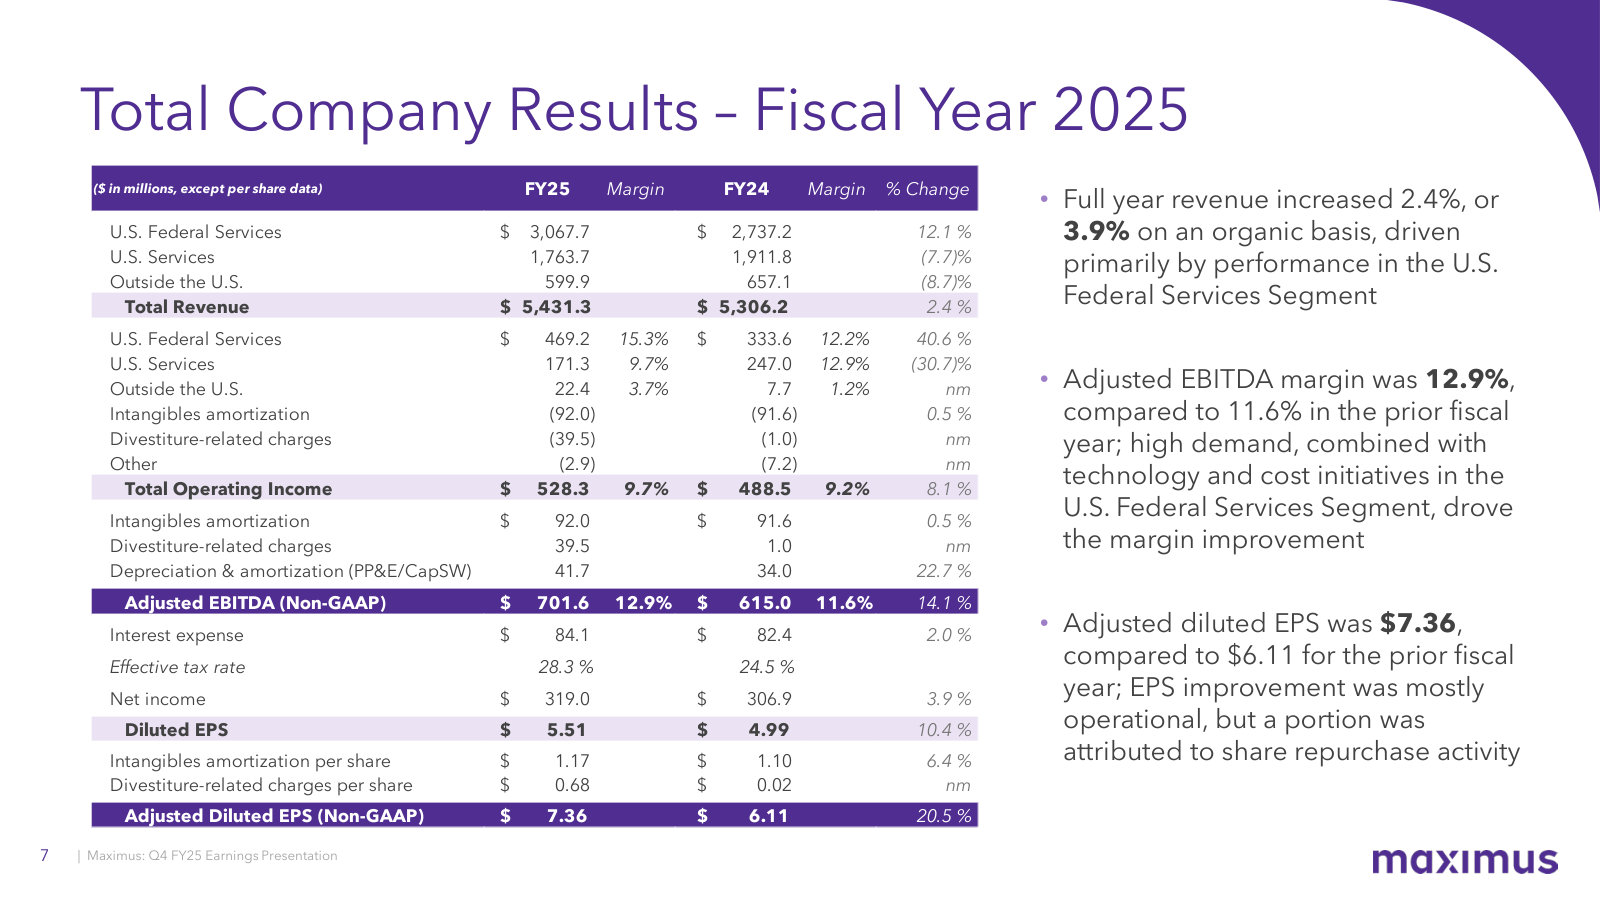
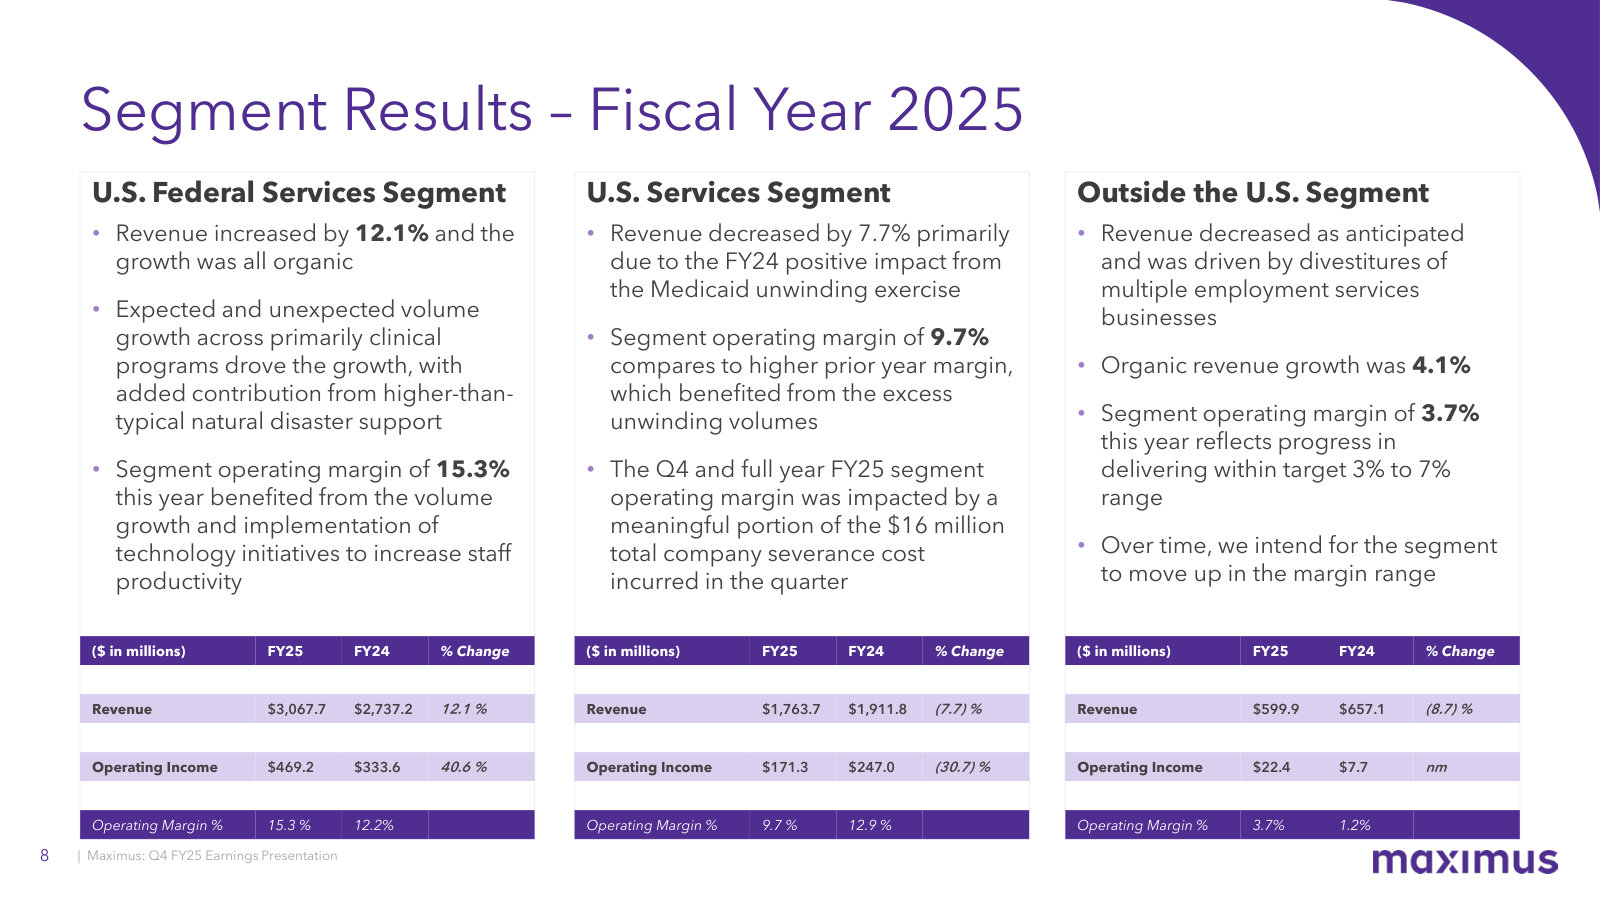
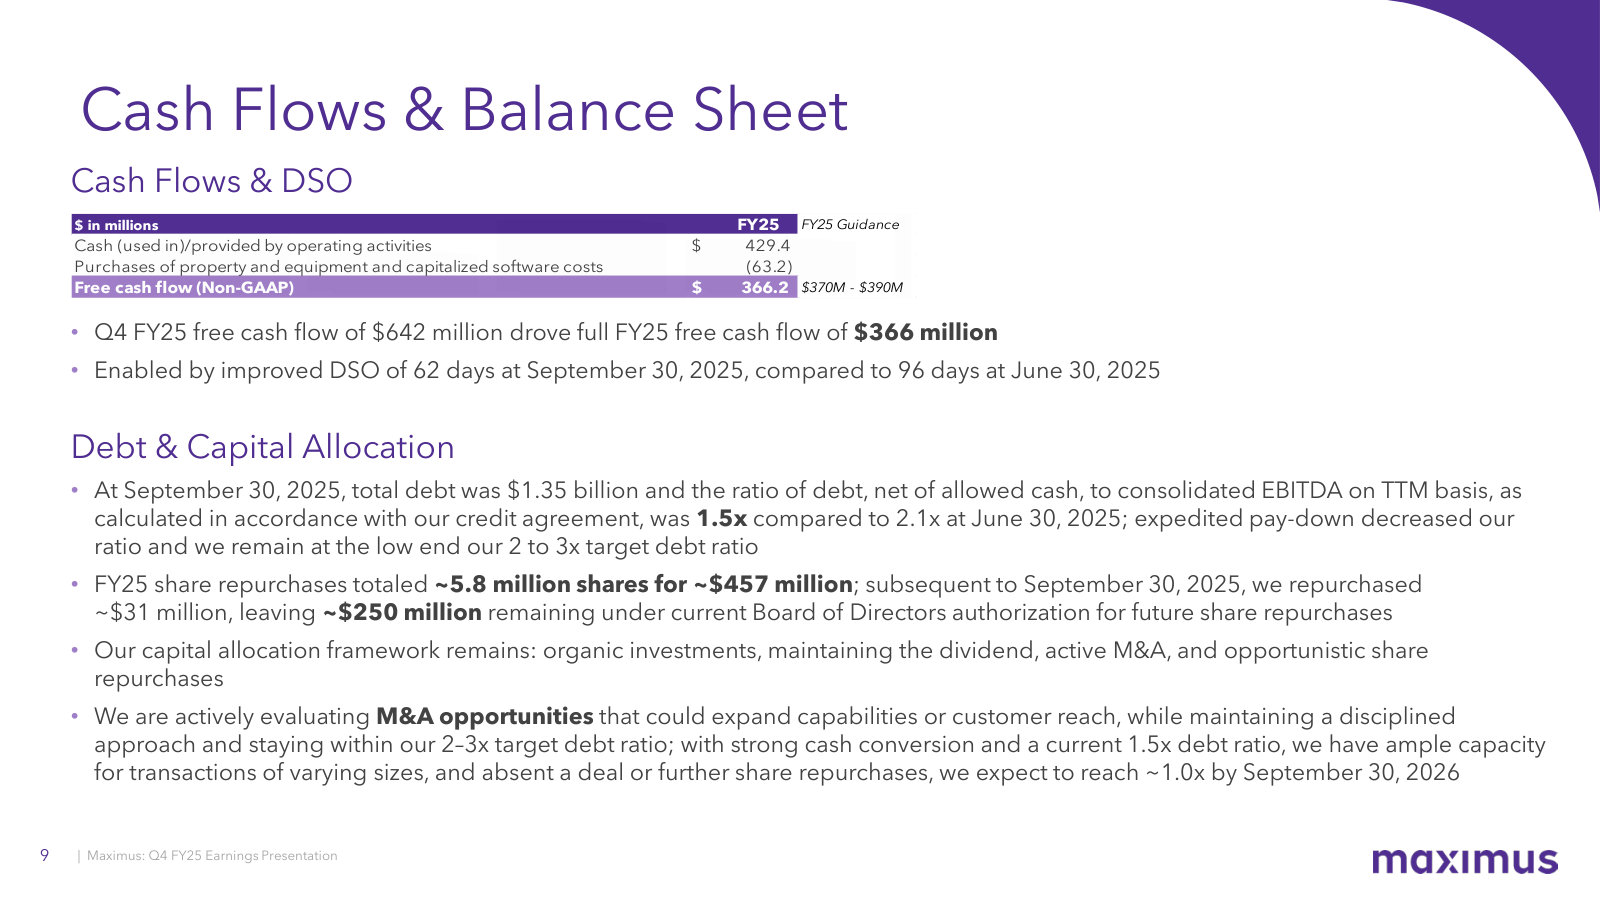
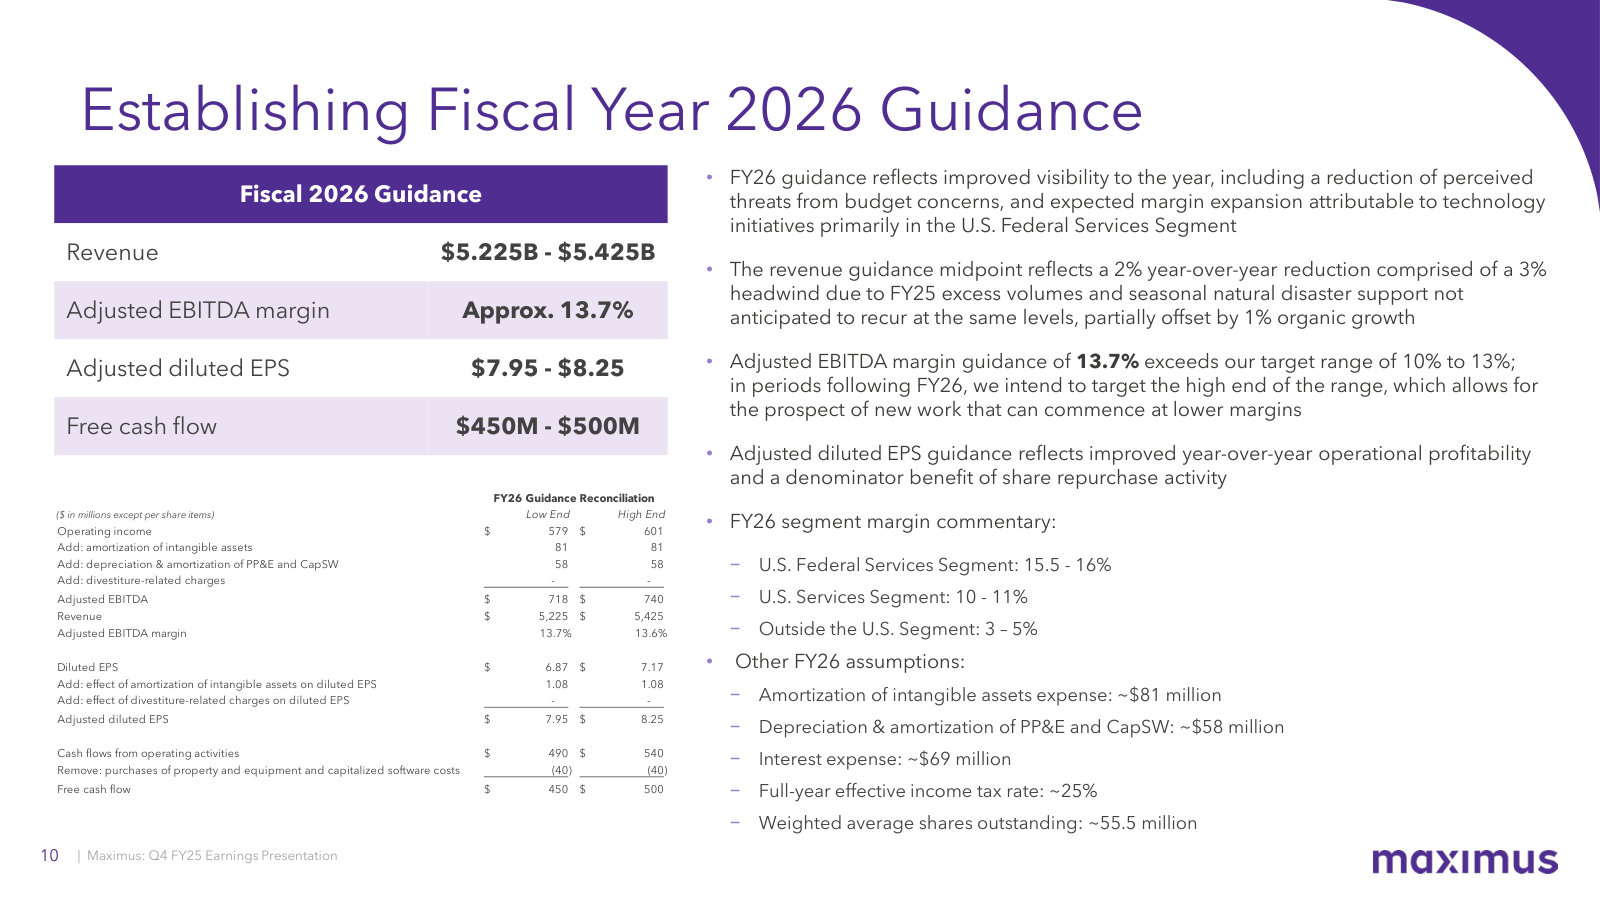
Fiscal 2025 Year End Earnings Call — FY2025
The full-year scorecard and FY26 setup: a complete year of segment economics and the priorities set for the year now underway. · Open the full document →
More from management
Fiscal 2026 First Quarter Earnings Call — Q1 FY2026 · 11 pages · The GSA contact-center BPA single award, and the first framing of how states will use Maximus under H.R.1. · Open →
Fiscal 2025 Third Quarter Earnings Call — Q3 FY2025 · 12 pages · Where the FY26 outlook started, and the OPM guidance change that reopened state contracting. · Open →
Fiscal 2025 Second Quarter Earnings Call — Q2 FY2025 · 18 pages · Management's answer to the DOGE question, and the case that the VES acquisition worked. · Open →
Fiscal 2025 First Quarter Earnings Call — Q1 FY2025 · 16 pages · The exit from Australian and South Korean employment services, and how Medicaid policy risk was framed at the time. · Open →
Fiscal 2024 Year End Earnings Call — FY2024 · 16 pages · The FY24 base year and the original FY25 guidance, useful for judging what actually got delivered. · Open →
Fiscal 2024 Third Quarter Earnings Call — Q3 FY2024 · 15 pages · Management's pre-election view of how a change in administration would and would not affect the book. · Open →
Fiscal 2023 Year End Earnings Call — FY2023 · 17 pages · Where the current three-pillar strategy was first laid out, and the full cost of the 2023 cybersecurity incident. · Open →
Fiscal 2023 Third Quarter Earnings Call — Q3 FY2023 · 20 pages · The peak-volume quarter: Medicaid redeterminations and student loan return-to-repayment, the comparison base that still distorts growth. · Open →
Maximus, Inc.'s management answers for the business every quarter. These are the exchanges that explain it best — verbatim, from the call transcripts preserved in Sources. Each link opens the full transcript at that page in a new tab.
Q2 FY2026 Earnings Call — Q2 FY2026
The most recent call: where the margin story now comes from, how H.R. 1 work is actually arriving, and why federal automates faster than state. · Open the full transcript →
Federal margin is being driven by decoupling labor cost from volume, not by more volume.
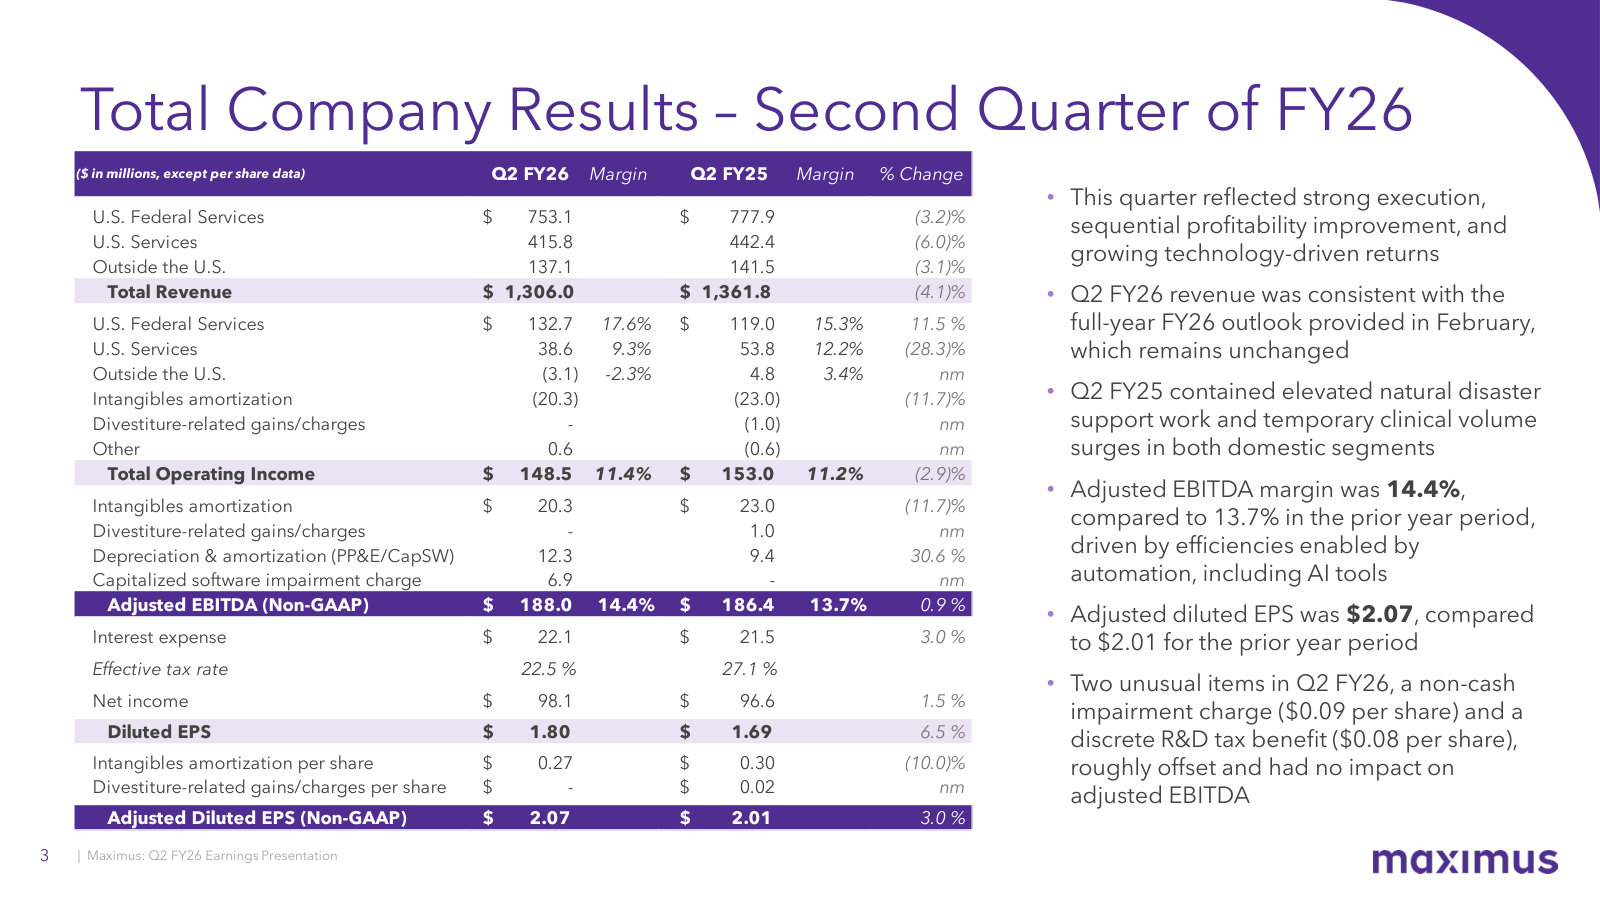
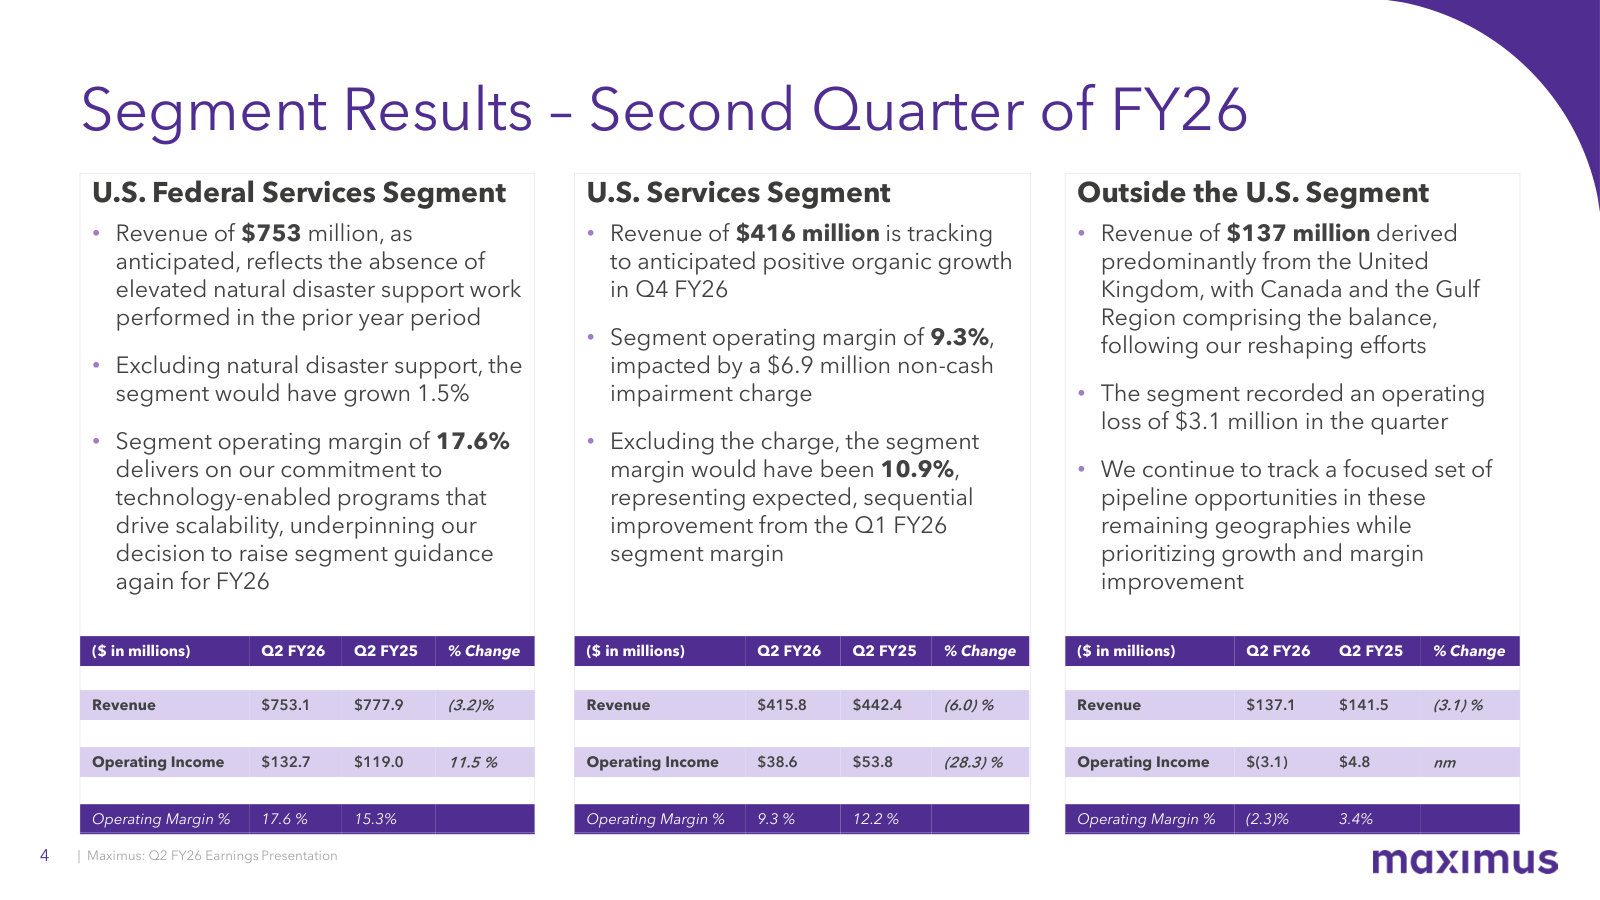
David W. Mutryn (Chief Financial Officer): The operating income margin for this segment in the second quarter was 17.6% as compared to 15.3% in the prior-year period. Another item I mentioned on the February call when we increased the full-year segment margin guide is the anticipated durability of this segment’s margins. This quarter’s segment margin is delivering on that commitment thanks to technology initiatives embedded in our programs that decouple labor costs from our ability to process more volumes. In fact, we are raising the margin guide for this segment again this quarter
p. 2 · Read in context →
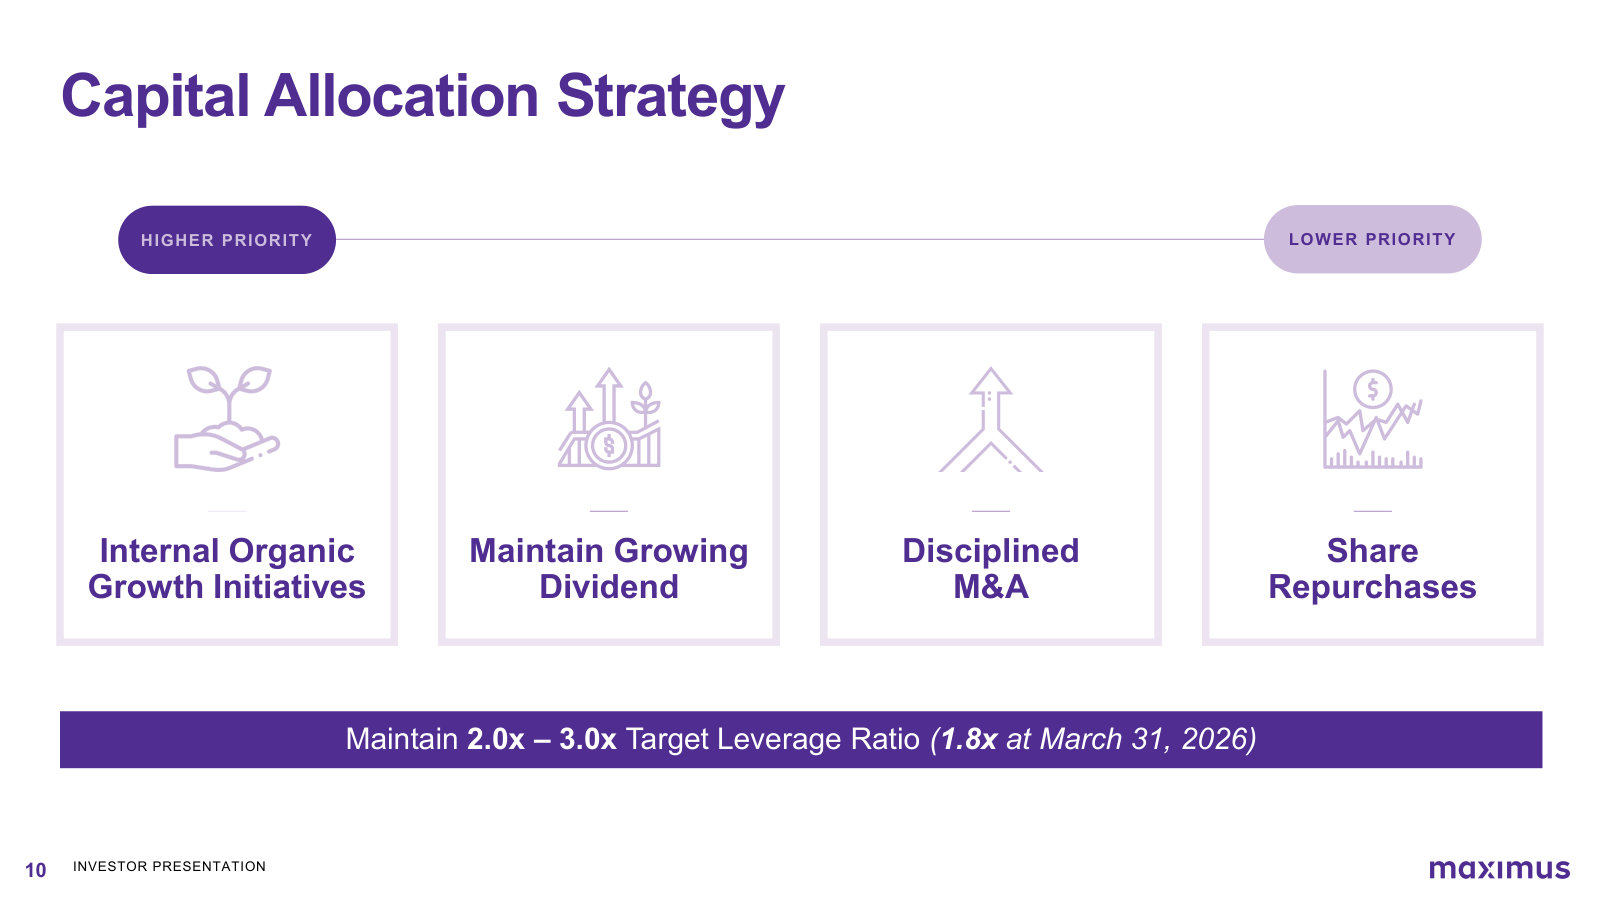
The capital allocation rule stated plainly: buy back only below intrinsic value, inside a 2x–3x leverage constraint.
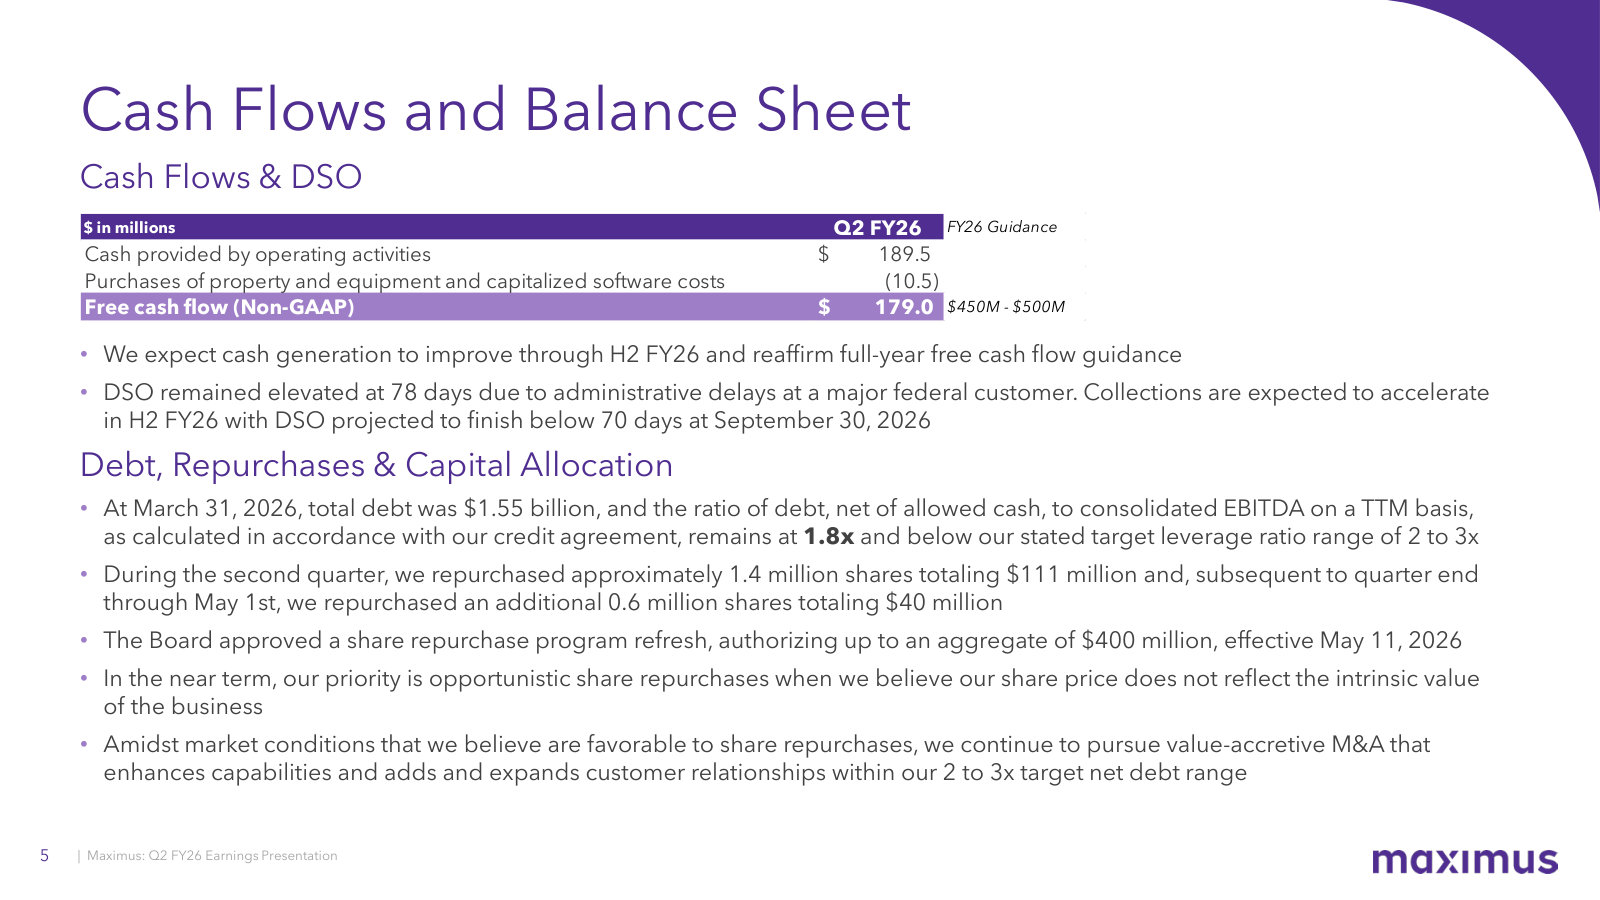
David W. Mutryn (Chief Financial Officer): We have long said that we are opportunistic in our share repurchasing. To be more direct, we prioritize repurchasing when we believe our share price does not reflect the intrinsic value of the business based on a disciplined and conservative assessment. Going forward, we will continue to execute on our capital deployment priorities while considering near-term liquidity, the potential M&A opportunity set, and all within the constraint of our stated target net debt ratio of 2x to 3x. Even amidst market conditions that are favorable to share repurchases, we continue to seek acquisition targets to accelerate longer-term organic growth. We remain focused on targets that add capabilities, add and expand customer relationships, and create revenue synergy opportunities. We also remain disciplined in our evaluation of targets and require that valuations must be reasonable in the context of current market conditions, and the expected return must exceed our cost of capital.
p. 2 · Read in context →
The near-term EBITDA margin target is reset from 10–13% to 12–15%, with the caveat that new ramps dilute it.
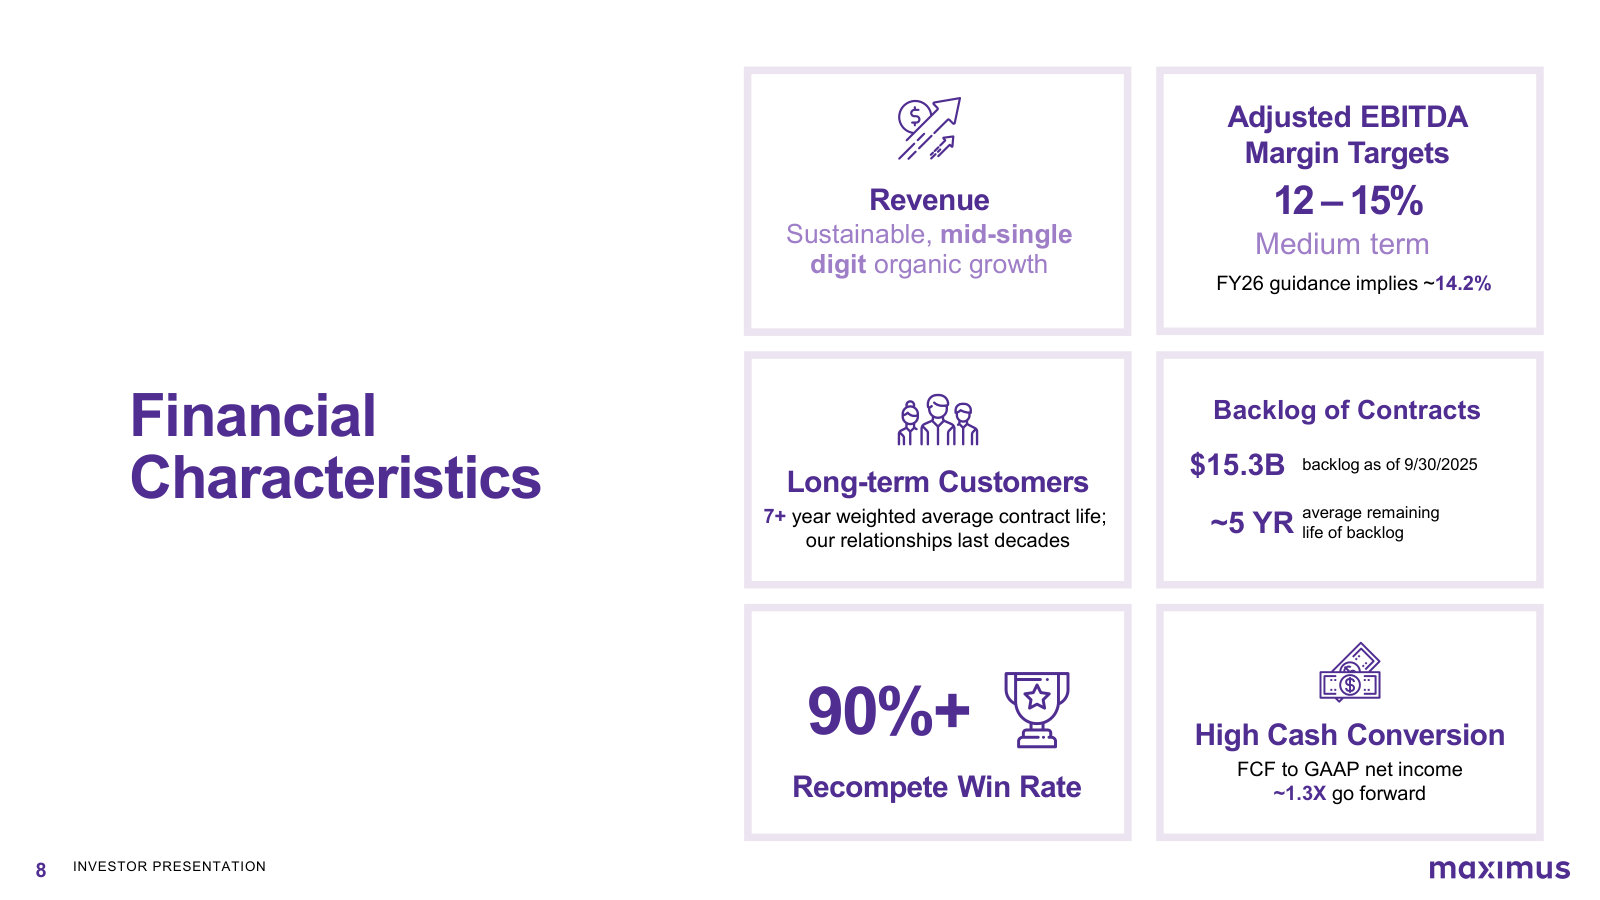
David W. Mutryn (Chief Financial Officer): Approximately 18 months ago, we laid out a near-term adjusted EBITDA margin target range of 10% to 13%. At that time, our margin was around 11.6%, and we are now guiding to approximately 14.2% for fiscal 2026. Much of the improvement has come from technology enhancements and cost actions that we believe have staying power. Given that progress, we are raising our near-term adjusted EBITDA margin target range to 12% to 15%. We expect to operate toward the upper end of that range in periods with stable volumes and continued technology leverage, while recognizing that new program ramps and mix can affect margins in any given year.
p. 3 · Read in context →
How H.R. 1 work reaches the P&L — often as volume on existing contracts rather than as new awards.
Bruce L. Caswell (President and Chief Executive Officer): On the state side, we are seeing solid traction in a number of areas related to H.R. 1, or the Working Families Tax Cut Act. Presently, there are two states working with us toward arrangements that could utilize our existing contracts to support Medicaid community engagement, or MCE, compliance. Depending on the contracting mechanism, these opportunities may either show up as higher volumes under existing contracts or be reported as new awards. One of these examples we estimate could drive a more than 30% increase in current program revenue, subject to final scope and implementation timing.
p. 5 · Read in context →
The cash-flow question: why DSO sits at 78 days and why management treats the receivable as collectible.
Will Gilday (CJS Securities); David W. Mutryn (Chief Financial Officer): I guess for David, any more color on the higher DSOs in the quarter? And you refreshed the buyback authorization, but how are you thinking about capacity for share buybacks considering the cash flow lumpiness? […] Yes, thanks. A little more color on the higher DSO. It stems from a major federal customer, as I said, and it is the same customer that contributed to the temporarily higher DSO in ou fiscal year 2025. We did anticipate a buildup of accounts receivable in our November guidance and then again in February when we said we expected DSO to remain elevated in Q2. A little more detail: this is a large program with extremely complex and data-intensive invoicing requirements. The slowdown in collections has occurred since November as we have worked with our customer on incorporating new and evolving requirements, many of which are retroactive, so may require rework of prior period invoices. This is a federal agency. We are operating under a funded contract, so we have full confidence that the outstanding invoices will be collected. We continue to regularly collect, but this customer’s AR increased in Q2, and our current view is that it may remain flat in Q3 before declining in Q4 as we expect to catch up and collect more than our revenue. That matches with my prepared remarks that we believe DSO may remain elevated as of June 30, then improve in Q4.
p. 6 · Read in context →
The best explanation of why automation lands in Federal first: contract scale, public trust, and state legacy systems.
Will Gilday (CJS Securities); Bruce L. Caswell (President and Chief Executive Officer): And then you keep raising the margin outlook on U.S. Federal based on tech initiatives and efficiency gains. Maybe add some more color on exactly what those efficiency gains are and why we have not yet seen a similar dynamic in the U.S. Services segment? […] First, our federal contracts are generally larger, meaning that when you implement technology initiatives, they get applied in that segment to programs that are larger from a scale and volume standpoint, so they are by definition going to be more impactful on the margins of the business. Second, many of our U.S. Services contracts, particularly in Medicaid and the health benefit exchange area, involve us delivering services directly to consumers, and that issue of public trust is front and center for our state customers. As a consequence, they have expressed decidedly more caution in the adoption of AI and other automation tools without first really understanding how guardrails can be put in place to ensure compliance with program regulations, which is super important to them. It is also worth noting that there is a patchwork quilt of regulations at the state level that our clients must individually navigate, whereas that is less the case at the federal level presently. Third, U.S. Services contracts certainly have great incremental technology opportunities in them, but they also operate in a fairly sophisticated environment that incorporates a lot of state systems. Therefore, there are multiple points of integration with state legacy systems required in executing our program delivery model. To give you an example, in one state our employees are trained across five different state systems in order to do their work. Environments like this are much more challenging to apply automation to, particularly when this has to be done across multiple vendor contracts that must be coordinated. Finally, to overlay all of this, our state customers already have a lot on their plates, particularly with the requirements for implementing H.R. 1. In many cases, they have limited bandwidth and do not have the budget resources to do a lot more than that. Performing the “system surgery” needed to really drive significant automation and change an already very stable and positive end user experience has become less of an immediate priority for them.
p. 7 · Read in context →
The largest recompete in the portfolio — VBA exams — with no rebid timeline yet published.
Will Gilday (CJS Securities); Bruce L. Caswell (President and Chief Executive Officer): Switching back to federal, do you have any updates on the VBA contract? Is a recompete still expected in the summer, or do you think there will most likely be an extension? And you have an industry day later this month—what are you looking to accomplish or learn there? […] The current contract, as a reminder, goes through December 31, 2026 for all vendors. The VA has not yet released a formal timeline for the rebid, and we expect to learn at the upcoming industry day what that timeline is intended to be. Generally speaking, agencies across government have the ability, if needed, to extend existing contracts as they complete their recompete process. We do not know yet if the VA will need or intend to do that; we may learn that at the industry day as well. We would expect to be able to share more information on subsequent calls as it becomes available from the customer. In the meantime, we are remaining completely focused on providing first-class service to veterans and to the VBA. We think we have earned the reputation for delivering a high-quality veteran experience. This is very much made possible by the many employees in our Veterans Evaluation Services subsidiary who themselves have served and are veterans. They understand the experience and how to navigate these programs, and they do so with a great deal of empathy and compassion. We feel like we are delivering great value to the VBA under the current contract and therefore we are optimistic about the future outcome of the rebid. We have a strong track record with the VBA, demonstrated delivery capabilities at scale and capacity, and we have made significant technology investments—continuing to invest—in further improving the veteran experience, with a specific focus on reducing the time that veterans spend in our portion of the MDE claims process. That is the update I am able to provide at this time.
p. 8 · Read in context →
Q1 FY2026 Earnings Call — Q1 FY2026
The clearest statement of how state revenue is actually earned — per transaction, not per enrollee — plus the size and timing of the H.R. 1 ramp. · Open the full transcript →
The single most important mechanic in the state business: volumes track engagements per beneficiary, not enrollment.
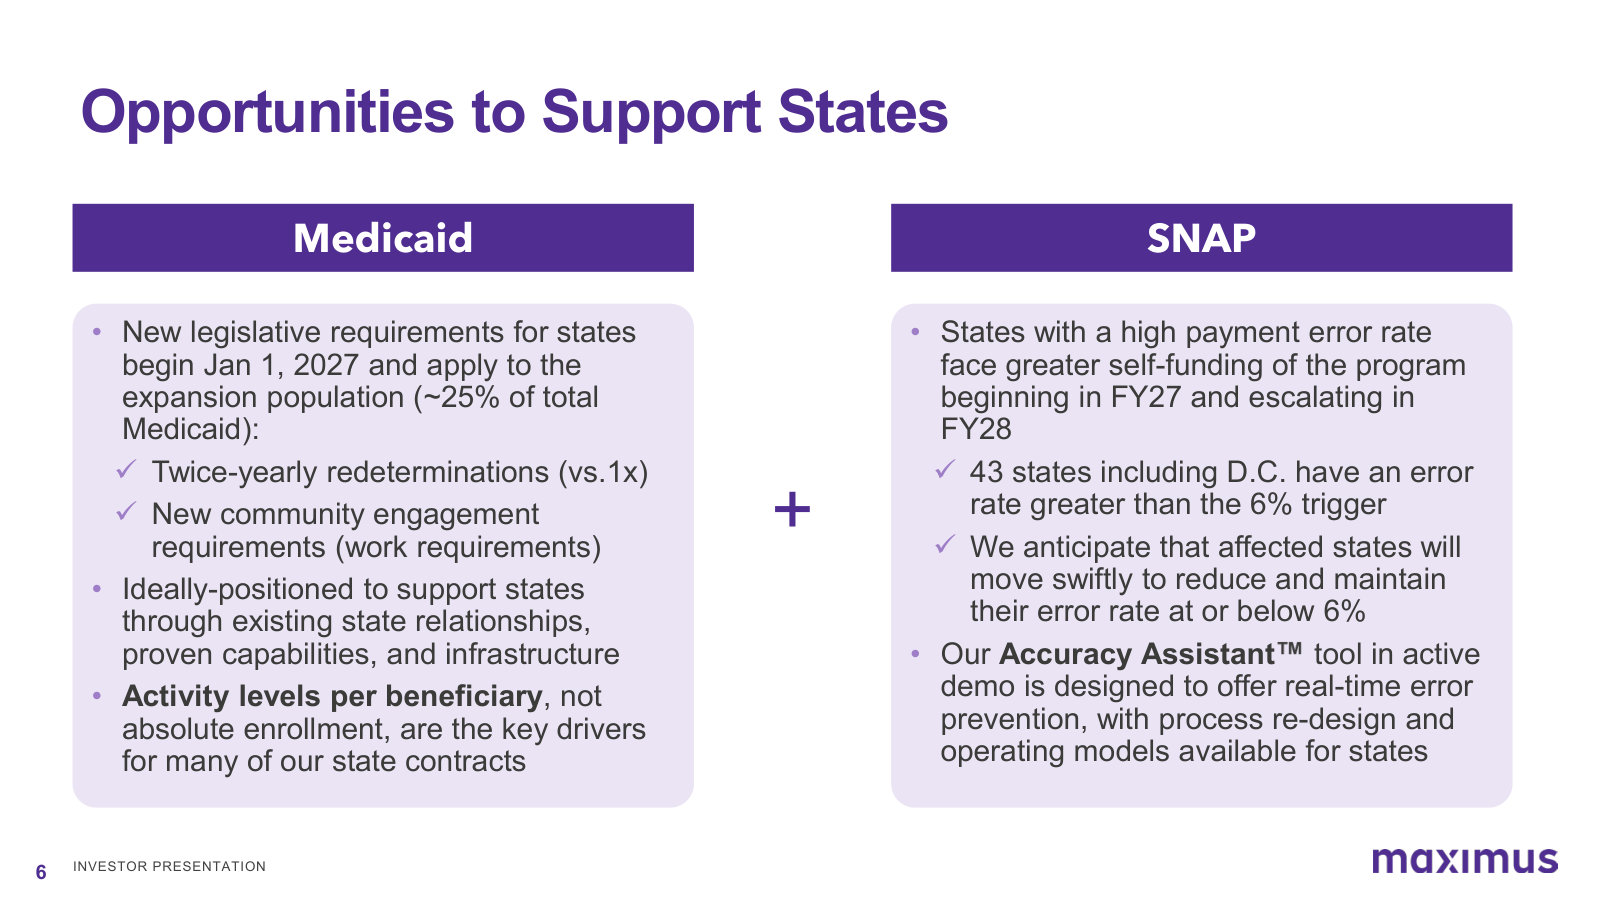
Bruce Caswell (President and CEO): We're fortunate to have strong working relationships through existing contracts with many of the expansion states for whom we already perform eligibility support services. We continue to see more frequent eligibility support driving up engagement with Medicaid beneficiaries. As we've noted previously, more frequent engagement is the principal driver of volumes on many of our state contracts. In other words, activity levels per beneficiary, not absolute enrollment, are the key drivers for many contracts.
p. 2 · Read in context →
Why states are forced to act on SNAP: an error rate above 6% shifts benefit and administrative cost onto them.
Bruce Caswell (President and CEO): Beginning in government fiscal year 2028, if a state has a payment error rate greater than 6%, which an estimated 43 states including DC do, they're required to begin contributing to the benefit in a manner correlated to their error rate. States may either use their FY '25 or FY '26 error rate for calculation of their share of food costs, making actions this year potentially consequential for many to reduce their payment error rates. Finally, under the WFTC Act, beginning in government fiscal year 2027, all states will be responsible for 75% of the administrative funding for SNAP.
p. 2 · Read in context →
The SNAP offering explained end to end — tool licence first, business-process redesign as the larger follow-on.
Bruce Caswell (President and CEO): To address it directly, the receptivity to our Accuracy Assistant has been really positive. It's a great tool. It's a tool quite frankly, think states have really needed because it allows you first of all to kind of to mine the datasets of existing cases and understand what the root causes are that could be driving error rates up in the first place. Sometimes those root causes are there are just fundamental inaccuracies between the data that an applicant is providing and data that could be available through third-party data sources that you want to check against. And that might be just because, you know, the data is stale or the individual is reporting the data in a different manner than, has been reported through other electronic means. Can also have inaccuracies that are related to just the training of individuals collecting the information. I know that I struggle with, you know, semi-monthly versus biweekly income. Which is which right that kind of thing. So the accuracy assistant tool helps first of all by learning and then it can be used real-time as cases are coming in and being processed. Processed to identify cases that have the attributes that could lead to an error if is not taken. It then allows the worker and that worker could be a state or county worker or it could be a Maximus, Inc. employee to intercede and collect further information from the beneficiary before you put inaccurate data into the database against which a rules engine runs that might make an inaccurate determination. It's important to recall too that error rate at state level both the positive errors and the negative errors in the sense that if you're underpaying someone, that's as much an error as if you're overpaying someone. So it's the collective score that a state has that has to be below 6%. […] Would say one other thing, and that's we'd expect the initial conversations with states to lead to interest in the tool and the licensing and deployment and implementation operation of the tool. And then on top of that, that's the near-term kind of effect. But in the longer term what you really want to do is have a conversation of how do we look at the workflow, business process, what fundamentally has led us to the state that we're in, honestly. And figure out how to redesign that and instrument that business process differently. So we think that there's a almost a consultative that could lead to business process services opportunities in the medium to longer term with the SNAP population with these states.
p. 7 · Read in context →
Management sizes the combined Medicaid and SNAP opportunity and dates the full run rate to FY2028.
David Mutryn (CFO): We had shared last year and really for the combination of emerging needs for Medicaid and SNAP with a multitude of assumptions, we estimated that potential needs by states for both Medicaid and SNAP all combined could create a high single to low double-digit organic growth opportunity for US services and we continue to believe that this is a reasonable estimate for the ultimate revenue run rate from this work once it's fully ramped. And as far as timing goes, we'd expect if new work would layer in over fiscal year 2027, and into fiscal year 2028. So fiscal year '28 at some point, could be kind of the full run rate of the new normal under these requirements.
p. 8 · Read in context →
Corrects the common modelling error — semiannual redeterminations do not create a January 2027 surge.
Bruce Caswell (President and CEO): I think as you're thinking about the future years, for Medicaid too, there's a dynamic that I don't think we've called out succinctly before that we wanted to make sure we were clear on. That is, the Medicaid, community engagement requirements for the expansion population are as you know effective 01/01/2027 but we likely will see activity in the '26 '27 as there's a lot of outreach activities that states have to engage in to that eligible population. And so they're sending letters, they're making phone calls and so forth saying, ready for this. This is gonna be a new requirement for you and so forth. That activity is something I think where states are still working through what portion of the population they actually have to directly reach out to. In some cases, the state might say, well, if I can, through data matching, preliminarily determine that a certain cohort of this expansion population doesn't actually qualify for the work requirement because they have certain conditions that meet exemption requirements. I'm not even gonna bother reaching out to them. But that's ground that hasn't been covered yet. And I think lawyers are talking about, well, do you just reach out to everybody? And then take it from there. So you'll see a bit of you know, kind of volatility in that as that shakes out. And I think CMS's guidance to states and the activities around as, you know, their recent announcement and so forth supporting states will help bring some clarity to that. The work requirement or community engagement requirement is a real thing as of January 1 with even some activities preceding that. The dynamic that we want to also focus on, though, is the redetermination. When you think about it the requirement for semi-annual redeterminations doesn't happen until January 1 and that means that the activity won't happen until July. Because you could have a new you know somebody who's newly determined eligible on 01/01/2027 you're not gonna need to redetermine their eligibility till July of that year. But I think there's been some thinking that you see this like major surge in redetermination activity starting in January. Not really the case. It's the cohorts that start rippling through mid-year. That's why David made the point earlier that '27 is a building and you get the full run rate benefit of these activities in '28.
p. 10 · Read in context →
Q4 FY2025 Earnings Call — FY2025 / Q4 FY2025
The annual call: the FY2026 guidance bridge, the deepest walk-through of the SNAP opportunity, and the M&A criteria in management's own words. · Open the full transcript →
Over half of revenue sits on performance-based contracts — the disclosure management treats as its differentiator.
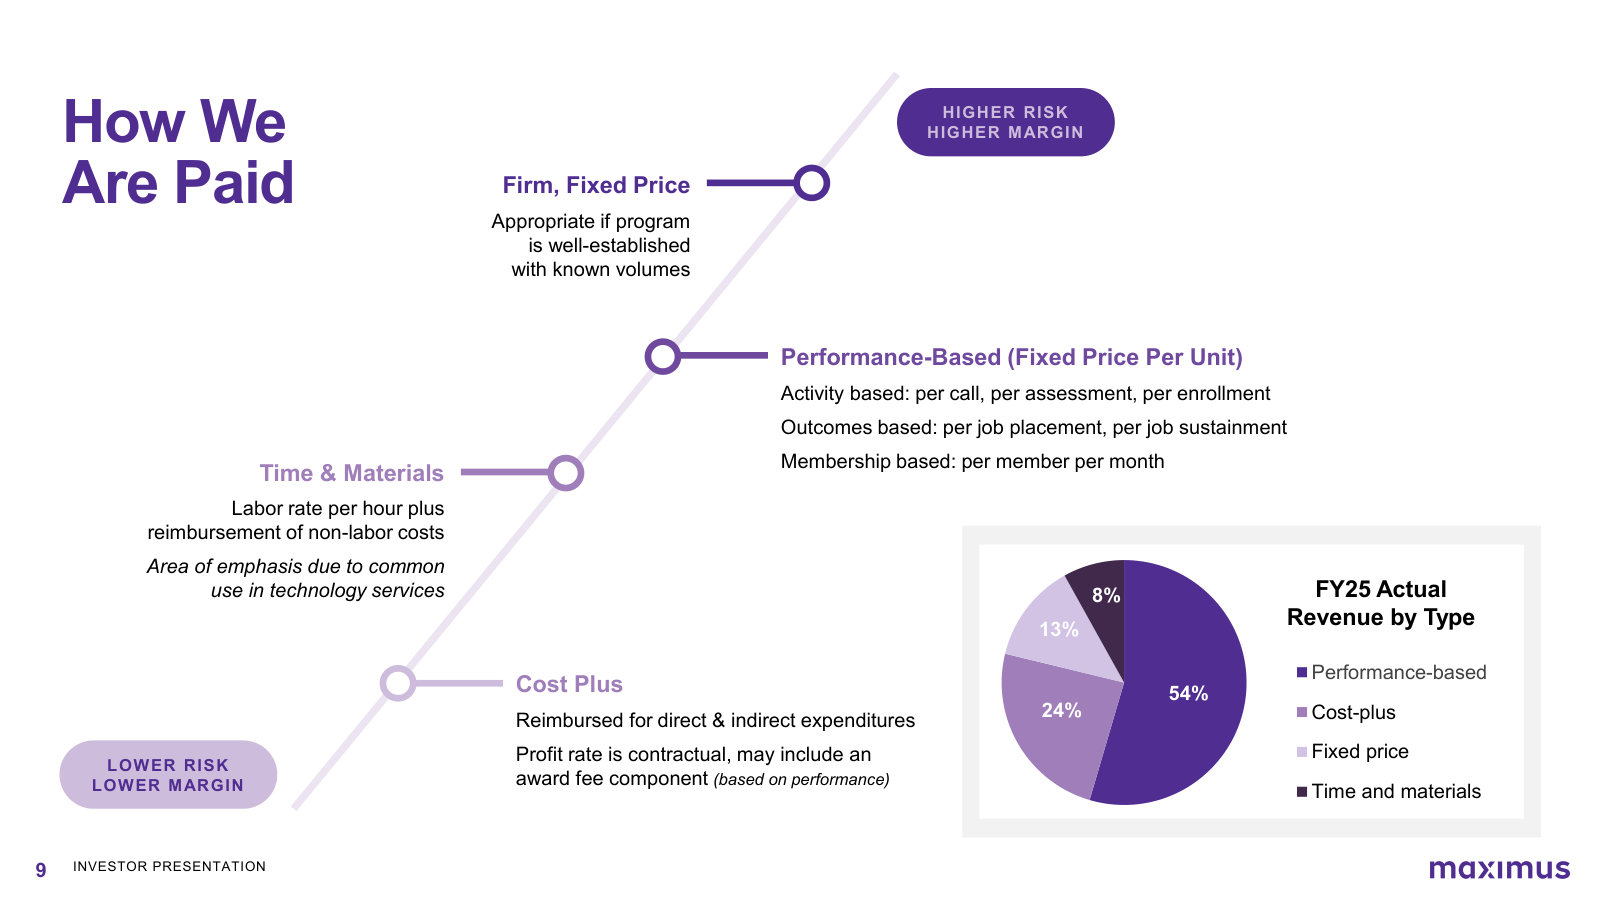
Bruce Caswell (President and CEO): To our knowledge, Maximus is the only public company in our sector that has formally documented its mix of contracts that are performance-based, which stands at 54.4% for fiscal year 2025. We believe this distinction reinforces our leadership in driving accountable and measurable results.
p. 2 · Read in context →
Why a book-to-bill below 1.0 is not the signal it looks like in a business with long, large contracts.
Bruce Caswell (President and CEO): As a reminder, we continue to view book-to-bill as a relevant forward indicator to pipeline conversion over the broader horizon, but not the sole determinant of the business' ability to grow organically. Also, in periods of lower than normal rebid activity, as we've experienced recently, the TTM book-to bill is expected to be below 1.0. Then in periods of greater rebid activity and given our larger contract lengths and values, the metric tends to show outsized performance.
p. 4 · Read in context →
The FY2026 revenue bridge: a 3% headwind from non-recurring surge and disaster work against 1% organic growth.
David Mutryn (CFO): With the revenue guidance reflecting how a portion of the excess volumes in fiscal 2025 are not anticipated to recur in fiscal 2026 along with seasonal natural disaster support that is inherently difficult to forecast. Those components are responsible for a year-over-year revenue headwind of approximately 3%, which we expect to partially offset with 1% of organic growth netting to a 2% year-over-year delta at the midpoint of guidance.
p. 5 · Read in context →
Guidance philosophy on margin: keep the range intact because new work starts at lower margin and improves.
David Mutryn (CFO): Notably, the margin guidance exceeds the company's target range of 10% to 13% that I stated at this point last year. Our intent is to leave this range intact and target the high end for the periods following fiscal 2026 to account for the prospect of a higher share of new work in the business. Often new programs at Maximus begin at a lower margin and improve over time, with the profile depending on the nature and pricing structure of the work.
p. 5 · Read in context →
The shutdown test: essential-service designation meant fewer than a dozen of ~40,000 employees were affected.
Bruce Caswell (President and CEO): We really don't anticipate any negative impacts on our delivery on our contract portfolio in Q1 FY 2026. Nearly all of our programs were deemed essential services by the government. And in some cases, some of those programs had received sufficient funding prior to the shutdown through other legislative vehicles like the IRA, for example. And my top comment there would be that this really reflects the very deliberate strategy of the company over the years to develop a very durable contract portfolio that fares well in these types of situations. So to put a little more color on it, I believe that across our base of nearly 40,000 employees, we were very fortunate to have fewer than a dozen that were impacted by funding curtailments in the portfolio.
p. 8 · Read in context →
The M&A screen: defense and national security, bought for customer access, capability, or business systems.
Bruce Caswell (President and CEO); David Mutryn (CFO): We've been fairly explicit with our investors in the marketplace noting that our priority in the near term is growth in the U.S. Federal market. And within that, we do have a bias toward the defense and national security space. Our research suggests that the CAGR in that area over the next several years is north of about 9%. We also believe from our research that the overall services marketplace and software spend in the defense community is well in excess of $150 billion and we believe the addressable component for Maximus to be nearly $50 billion. So an excellent market and one that's growing and one candidly that we've now established, our ability to win in on an organic basis. So if we think about how we would further accelerate our growth potential as a business, there are three categories, if you will, that we've been considering. The first is access to customer relationships, because qualified past performance is just so important in this market to win in this market. And in some cases, there would be contract vehicles that we could potentially gain access to through a combination with another company. The second category is technical capabilities to augment what we are already bringing to bear in the marketplace through the mission threads and the accelerator work that I mentioned in my prepared remarks. And the third is business system capabilities. While some of those can be and certifications, if you will, while some of those can be achieved organically like the CMMC level two certification that we've mentioned, others like having a certified purchasing procurement system, the faster path to those is sometimes through a combination or an acquisition. […] But I do want to emphasize that our primary reason for M&A is to unlock organic growth potential, which we believe can deliver significant value over the longer term. So that's really what we look for is revenue synergies and organic growth acceleration.
p. 9 · Read in context →
Q3 FY2025 Earnings Call — Q3 FY2025
The landmark call on the One Big Beautiful Bill Act — what it changes, what it could be worth, and why a conflict-free operator is advantaged. · Open the full transcript →
Medicaid work requirements arrive in 2027 — and the law bars managed care plans from doing the verification.
Bruce L. Caswell (President and CEO): Starting January 1, 2027, states will be required to verify with participants completion of 80 hours per month of qualifying activities. This is a major policy change, but not one with which we lack familiarity. During President Trump's prior administration, at the direction of one of our state clients, Maximus developed and implemented operational modifications designed to make beneficiary work requirement reporting as accessible and efficient as possible while meeting policy objectives. With this new statute in effect, we are again working with our state customers to demonstrate how to modify program operations to comply with the new law while maintaining a high level of quality of beneficiary engagement. Notably, the new law prohibits managed care plans from performing work activity verifications or handling exemption requests, which would constitute a conflict of interest. As an established conflict-free partner, Maximus has the independence necessary to support our state clients with compliance under the new legislation.
p. 2 · Read in context →
Book-to-bill in context: on-contract growth, not awards, drove the last year of revenue and EBITDA.
Bruce L. Caswell (President and CEO): In a BPO-centric business like ours, with average contract length and values at the higher end of the industry, the TTM book-to-bill metric is naturally sensitive to rebid timing. […] As such, we view book-to-bill as only one measure of future growth. To illustrate, our book-to-bill at the end of the third quarter of fiscal year 2024 was 0.6x. Since then, revenue has grown 4.3% and adjusted EBITDA 15%, underscoring how on-contract growth is another important source of organic growth, providing added strength and resilience to our portfolio.
p. 3 · Read in context →
Why margin overshoots in surge quarters — incremental volume drops through on an already-built cost base.
David W. Mutryn (CFO): This quarter's adjusted EBITDA margin is noticeably above the high end of our target range. This can happen in periods where volumes are stronger than anticipated, thanks to our ability to gain operating leverage on incremental volumes. This leverage is partly the result of our intentional investments in technology, workflow optimization, and cost models.
p. 4 · Read in context →
Management translates the legislation into a segment growth rate, and dates the contribution to FY2027.
Charles S. Strauzer (CJS Securities); Bruce L. Caswell (President and CEO): Could you start by discussing the Big Beautiful Bill and how Maximus might benefit from potential opportunities? What are the main drivers behind those opportunities? […] As we've examined market opportunities, it’s worth noting that the prospects in other program areas are actually more significant than those in the Medicaid sector. To elaborate, the One Big Beautiful Bill Act, or OBBBA, has notable implications for our U.S. Services segment, particularly within Medicaid and SNAP to start. There's a greater focus on program eligibility and work requirements, which I mentioned earlier. We believe these will positively influence U.S. Services organic growth, although we're not factoring them heavily into our fiscal year 2026 guidance at this time. We see them as contributing to growth in fiscal year 2027 due to the time needed to move from legislation to implementing regulations, which we understand won't be finalized until June 2026. States will then have until December 2026 to prepare for implementation in January 2027. Historically, we have seen the U.S. Services segment capable of low to mid-single-digit organic growth, while the federal side trends toward mid- to highsingle digits. We anticipate that the Medicaid work requirements and the need to reassess eligibility for the expansion population twice a year will provide a positive boost to the U.S. Services growth rate, potentially moving it to the mid- to high-single-digit range over time.
p. 6 · Read in context →
The competitive moat: conflict-free status, 23 states, ~60% of Medicaid enrollees, and infrastructure the state already paid for.
Charles S. Strauzer (CJS Securities); Bruce L. Caswell (President and CEO): And just looking at your competitive advantage against potential competitors that are out there. When you think about the conflict-free nature of your business, are there many competitors that can claim the same level of conflict-free? […] We've said for many years that we've made a very deliberate decision to remain independent and conflict-free and in particular, have no direct or indirect financial relationships with payers or providers, which is very critical to the work that we do in the Medicaid space and to a certain degree as well with Medicare. It was very important to us that from a work requirement standpoint, this work needs to be done in a conflict-free manner where beneficiaries are reporting, obviously, whether they're engaged in work, but more importantly, whether they may have a qualifying condition that could exempt them from those requirements. As I noted, that then becomes really off limits in terms of managed care plan engagement with beneficiaries. That's an important element of the law that's been passed that I think is only now becoming recognized within the state community, and we're helping to ensure that that's the case. In terms of other companies in a similar position, we've noted smaller privately held companies that have similar characteristics. But I would just say size matters in this market, and we have an established presence as the Medicaid managed care enrollment broker in about 23 states presently. We probably serve roughly 60% of the individuals nationally in the Medicaid program. As evidence in the results this quarter, scale is everything in this area of the business. We think that the invested infrastructure that's been bought and paid for by government can be easily modified at an incremental expense and not a massive new cost of investment, which puts Maximus in a great position to help address these opportunities and creates a bit of a competitive barrier.
p. 8 · Read in context →
Q2 FY2025 Earnings Call — Q2 FY2025
The call where the DOGE shock was actually sized — a $4 million revenue impact on a $5 billion base — and the pricing-concession risk was named. · Open the full transcript →
Two concrete AI deployments and what they bought: backlog cleared, temporary labour cut, staff shifted to QA.
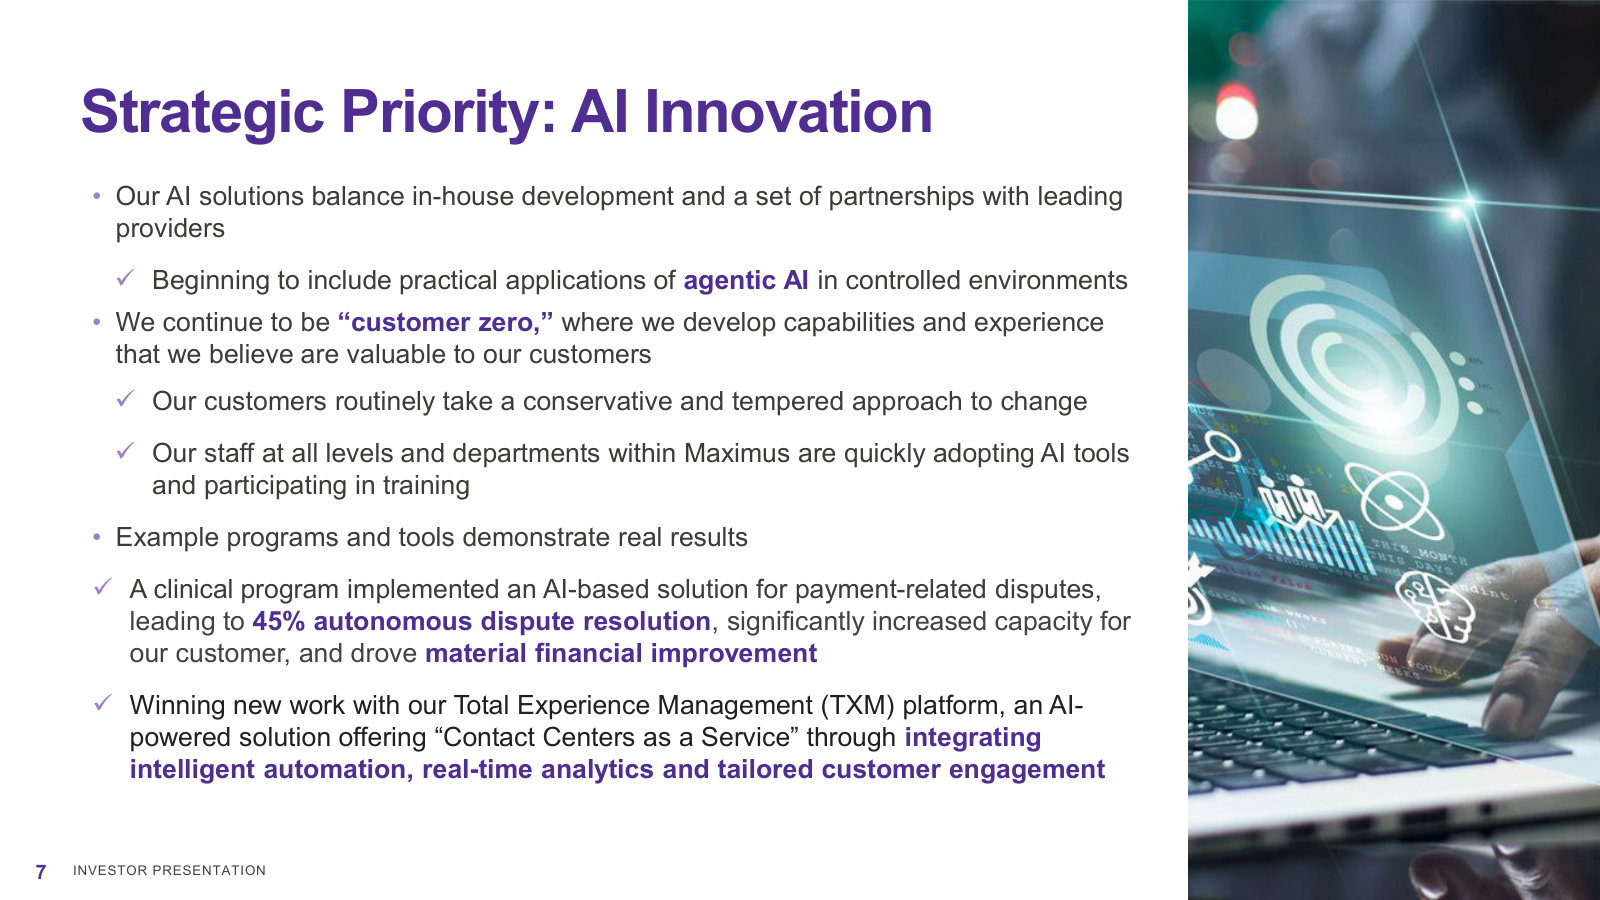
Bruce L. Caswell (President and CEO): First, on our federal No Surprises Act contract, where we provide arbitration services to resolve out-ofnetwork payment disputes between insurance providers and care facilities, we recently implemented an AI solution that is designed to streamline the independent dispute resolution process. This greatly enhanced process efficiency, cutting down on manual effort and boosting throughput. This automation helped clear a backlog of disputes, ensured SLA targets were met, reduced temporary labor costs, provided more meaningful work for our employees, and supported significant growth in project volumes. Secondly, working with the Department of Veterans Affairs, or VA, we've invested significantly to accelerate case preparation on our MDE contract. In the past, organizing and categorizing the information in medical records was a labor-intensive and highly repetitive process, with case files averaging between 5,500 pages. Given the importance of this program to the VA and our commitment to provide timely service to our nation's veterans, there was an urgent need for investment in automation. By leveraging tools such as AWS, GovCloud, and Amazon Textract, Maximus developed a proprietary AI and machine learning-powered records processing system. Since implementation, we have reduced the time required for manual case preparation, enabling us to take on greater volumes in the wake of the PACT Act. This solution has also enabled us to shift labor to higher-value work, such as quality assurance, contributing to the VA's objective of faster claim resolution for our deserving veterans.
p. 1 · Read in context →
The federal cost-cutting shock, quantified: roughly $4 million of FY2025 revenue, with pricing concessions still live.
Bruce L. Caswell (President and CEO): The impact of DOGE decisions on the business to date has been limited to a handful of small contracts where budget or scope has now been modified, some of which were already scheduled to end this fiscal year. More specifically, to date, these actions are estimated to total about $4 million in FY 2025 revenue, a de minimis figure on our base of $5 billion plus of revenue. That said, the environment in which we are operating continues to evolve, and we are maintaining a balanced stance of both supporting our customers in response to inquiries as well as leaning into opportunities to shape the future of certain programs. As an example, like others in our sector, we have fielded requests for pricing concessions on certain contracts, which leads to a process of mutual negotiation in due course. We recognize that this is an ongoing process, which may lead to further requests and reflects the systematic review of government spending that has been a communicated priority of the administration.
p. 1 · Read in context →
"Flexibility to contract" — the merit-system certification that lets states outsource program administration.
Bruce L. Caswell (President and CEO): Recently, guidance was issued to reaffirm states' authority to use private sector partners that meet merit system principles. This framework, administered by the Office of Personnel Management, or OPM, is fundamental to the agency's mandate to ensure transparency, fairness, and merit-based management of employees across the public and private sectors. The challenge for states is that managing growing complex populations often exceeds the realistic constraints of the government workforce, leading to reduced service quality and a poor citizen experience. For many states, scaling up a permanent workforce is neither a practical nor cost-effective solution. Maximus was the first organization in our sector to certify that its systems of personnel management meet the high standards government demands of its own workforce, fully complying with government merit system principles.
p. 1 · Read in context →
Why Medicaid cuts need not be a revenue headwind — activity, not headcount, drives the contracts.
Bruce L. Caswell (President and CEO): As discussed in February, changes that require customer engagement, such as verifying eligibility, typically increase our activity volume, which is our primary contracting model for state Medicaid programs. Therefore, a reduction in Medicaid recipients may not necessarily decrease consumer engagement, especially if eligibility verification or activity reporting requirements become more frequent than today. Additionally, in many of our largest states, we also manage state-based exchanges where customers can enroll if they are no longer eligible for Medicaid. This helps maintain our ongoing engagement with those consumers.
p. 3 · Read in context →
Guidance philosophy under uncertainty: bank the beat, hold the back half, and build in room for downside.
Charlie Strauzer (CJS Securities); David Mutryn (CFO): It looks like the raise is basically encompassing the amount of the beat in the quarter, kind of leaving the back half of the year largely unchanged. How should we think about that and also the weighting between Q3 and Q4? […] As I said in our prepared remarks, our intent with the guidance range was to reflect the Q2 overperformance, as you said, and then effectively maintain guidance for Q3 and Q4. So that does result in a natural step down from the exceptional Q2 performance. As always, we assess the risks and the opportunities as we see them today and as you can imagine, the range of outcomes is a bit wider than typical for us at this point of the year. And our intent with guidance is to provide a range that we have a high probability of delivering. So said differently, in a normal environment, we may have raised the guidance a bit more, but in this environment of both risk and opportunities, we felt it prudent to hold the remainder of the year guidance. So just a few more points I'll make to be clear about what our guidance assumes. First, a natural step down from Q2 to Q3 that we do have visibility into, and that would be some moderation to clinical volumes, as I said in my prepared remarks. Also, less seasonal work, such as disaster response support that we provide to FEMA, and in some cases, ramping up of costs on certain contracts. Second, a reminder that we have no reliance on new work contributing to the fiscal year, which we had also derisked in our prior guidance. And that's despite our continued optimism on the new business front, which includes, of course, opportunities that may arise from emerging customer priorities. And then last, by holding it flat, we've also allowed for some level of uncertainty to be accommodated. Related to headwinds that we don't have visibility to, may potentially arise from the macro environment. So we're deliberately taking a cautious approach that can accommodate some downside by design.
p. 6 · Read in context →
Q4 FY2024 Earnings Call — FY2024 / Q4 FY2024
The pre-transition baseline: how the portfolio is built to survive administration change, how book-to-bill really works, and where the 10–13% margin target came from. · Open the full transcript →
The structural argument: entitlement and mandatory-spending programs with bipartisan support, and a still-undigitised government.
Bruce Caswell (President and CEO): Our position as the largest partner to government in the administration of well-established entitlement and related mandatory spending programs has enabled us to deliver strong financial results with positive long-term trend lines spanning many administrations. Some of the largest mandatory spending programs we support, such as compensation and pension benefits for veterans, are perennially supported on a bipartisan basis. When we set our last strategic vision for the company, there was a deliberate focus on bipartisan priorities that are fundamental to the government's role in supporting its citizens. For example, with considerable government business still transacted on paper, the need for citizen services digitally enabled is undisputed. To date, only two percent of federal government forms have been digitized.
p. 1 · Read in context →
Book-to-bill decoded: rebid timing, not demand, is what pushes the ratio below 1.0.
Bruce Caswell (President and CEO): For context, about half of our awards were new work, so only 0.2 times came from rebids. Despite a historically consistent rebid win rate of about ninety percent. If rebids were evenly distributed, a typical year would have nearly 1.0 times coming from rebids alone.
p. 3 · Read in context →
The CMS contact-center recompete: Maximus took its own customer to the Court of Federal Claims over the solicitation terms.
Bruce Caswell (President and CEO): As a reminder, the increased pipeline is largely driven by the CMS contact center operations or CCO contract, valued at $6.6 billion. Our commitment to challenging the basis for and legality of the CCO solicitation remains unchanged. Last month, after receiving a partially sustained ruling from our GAO protest, we filed suit in the US Court of Federal Claims or COC. Concurrently, we sought and received a stay of award from the government until March 15th, 2025, to facilitate judicial review and allow the court to render its decision […] We remain steadfast in our view that the labor harmony agreement requirements in the solicitation are unnecessary, inappropriate, and illegal.
p. 3 · Read in context →
How guidance is de-risked: only ~2% of revenue from work not yet won, versus a normal 5%.
David Mutryn (CFO): However, given the risk of procurement delays relating to the transition of the new administration, we have been prudent in derisking our revenue guidance which now includes only about two percent of revenue from new work not yet won. Typically, that figure would be five percent or a bit more. This small amount of new work that we have included assumes partial contributions in fiscal 2025 but would drive more significant contributions to fiscal 2026 and beyond.
p. 6 · Read in context →
Where the 10–13% adjusted EBITDA target range was set — the benchmark later raised to 12–15%.
David Mutryn (CFO): Looking further ahead and following the transition to adjusted EBITDA guidance, we wanted to provide a current view on our near-term margin expectation. We believe a reasonable range in the near term is 10 percent to 13 percent adjusted EBITDA margin. With our guidance for fiscal year 2025 of approximately 11 percent, this range demonstrates our view that there are further opportunities for margin enhancement in the years following fiscal 2025. We also have some contingency built into the low end of the range to account for uncertainty that is inherent looking further into the future.
p. 7 · Read in context →
More calls
Q1 FY2025 Earnings Call — Q1 FY2025 · 8 pages · The first read on the new administration and DOGE, plus the completed exit from Australia and South Korea that reshaped the Outside the U.S. segment. · Open →
Q3 FY2024 Earnings Call — Q3 FY2024 · 10 pages · Management pre-announces the normalisation: more than half of the FY2024 guidance raise is flagged as volume that will not recur. · Open →
Q2 FY2024 Earnings Call — Q2 FY2024 · 9 pages · Peak Medicaid-unwinding economics — both domestic segments at the top of their long-term margin targets, with the Maximus Forward build-out underway. · Open →
Q1 FY2024 Earnings Call — Q1 FY2024 · 10 pages · The mechanics of Medicaid redeterminations while they were running, and the first framing of Maximus Forward as a reinvestment programme. · Open →
Q4 FY2023 Earnings Call — FY2023 / Q4 FY2023 · 13 pages · The trough year explained: the public-health emergency, deferred student loan payments, the $22 million cyber incident, and the start of the international reshaping. · Open →
Q3 FY2023 Earnings Call — Q3 FY2023 · 10 pages · The quarter redeterminations restarted and the cybersecurity incident was disclosed — the baseline against which every later 'excess volume' comparison is made. · Open →
Maximus, Inc.'s annual reports contain management's most considered account of the business. These are the sections, passages and visual pages worth opening in the originals preserved in Sources.
Maximus, Inc. — FY2025 Annual Report (Form 10-K) — FY2025
The current account of the business: three segments, contract economics, backlog, and the risks management flags today. · Open the full document →
Item 1. Business — General — p. 8 · Read the full section →
Management's own statement of what Maximus sells and why governments buy it.
How the company describes the value it creates for government clients.
We create value for our customers through our ability to translate public policy into operating models that achieve outcomes for governments at scale. Our work covers a broad array of services, including the operation of large health insurance eligibility and enrollment programs; clinical services, including assessments, appeals, and independent medical reviews; and technology services. These services benefit from an industry with increasing demand, constrained government budgets, and an increased focus on technology as governments prioritize modernization.
p. 8 · Read in context →
Our Business Segments — p. 9 · Read the full section →
Sets out the three segments, their revenue shares, and the two engines: federal clinical work and state Medicaid services.
U.S. Federal Services — 56% of revenue, led by VA medical disability examinations.
Our U.S. Federal Services Segment generated 56% of our total revenue in fiscal year 2025. […] Clinical Services. In line with our strategic focus for the future, we continue to expand our clinical programs, most notably through the U.S. Department of Veteran Affairs (VA) medical disability examinations (MDE) contracts. As a leading provider of MDEs, we administer the clinical evaluation process for U.S. veterans and service members on behalf of the VA and manage a vast network of experienced clinicians focused on serving veterans. This highly scaled platform in the U.S. federal government domain is an in-demand capability across a multitude of agencies.
p. 9 · Read in context →
U.S. Services — 32% of revenue, anchored in Medicaid eligibility and exchange operations.
Our U.S. Services Segment generated 32% of our total revenue in fiscal year 2025. […] As a leading supplier in many of the health program administration markets that we serve, we are the largest provider of Medicaid eligibility support and enrollment services and state-based health insurance exchange operations. […] Clinical services is a growing portion of the segment and demonstrates successful focus and execution of our continued strategy.
p. 11 · Read in context →
Outside the U.S. Segment — p. 13 · Read the full section →
The segment Maximus spent three years shrinking; read against the FY2023 edition below.
The reshaping stated as complete: divestitures across FY2023–FY2025 to reduce volatility.
Our Outside the U.S. Segment generated 11% of our total revenue in fiscal year 2025. […] We have reshaped this segment to align with the broader Maximus strategy. Through fiscal years 2023 to 2025, we divested a number of businesses with a goal of reducing volatility in the performance of this segment.
p. 13 · Read in context →
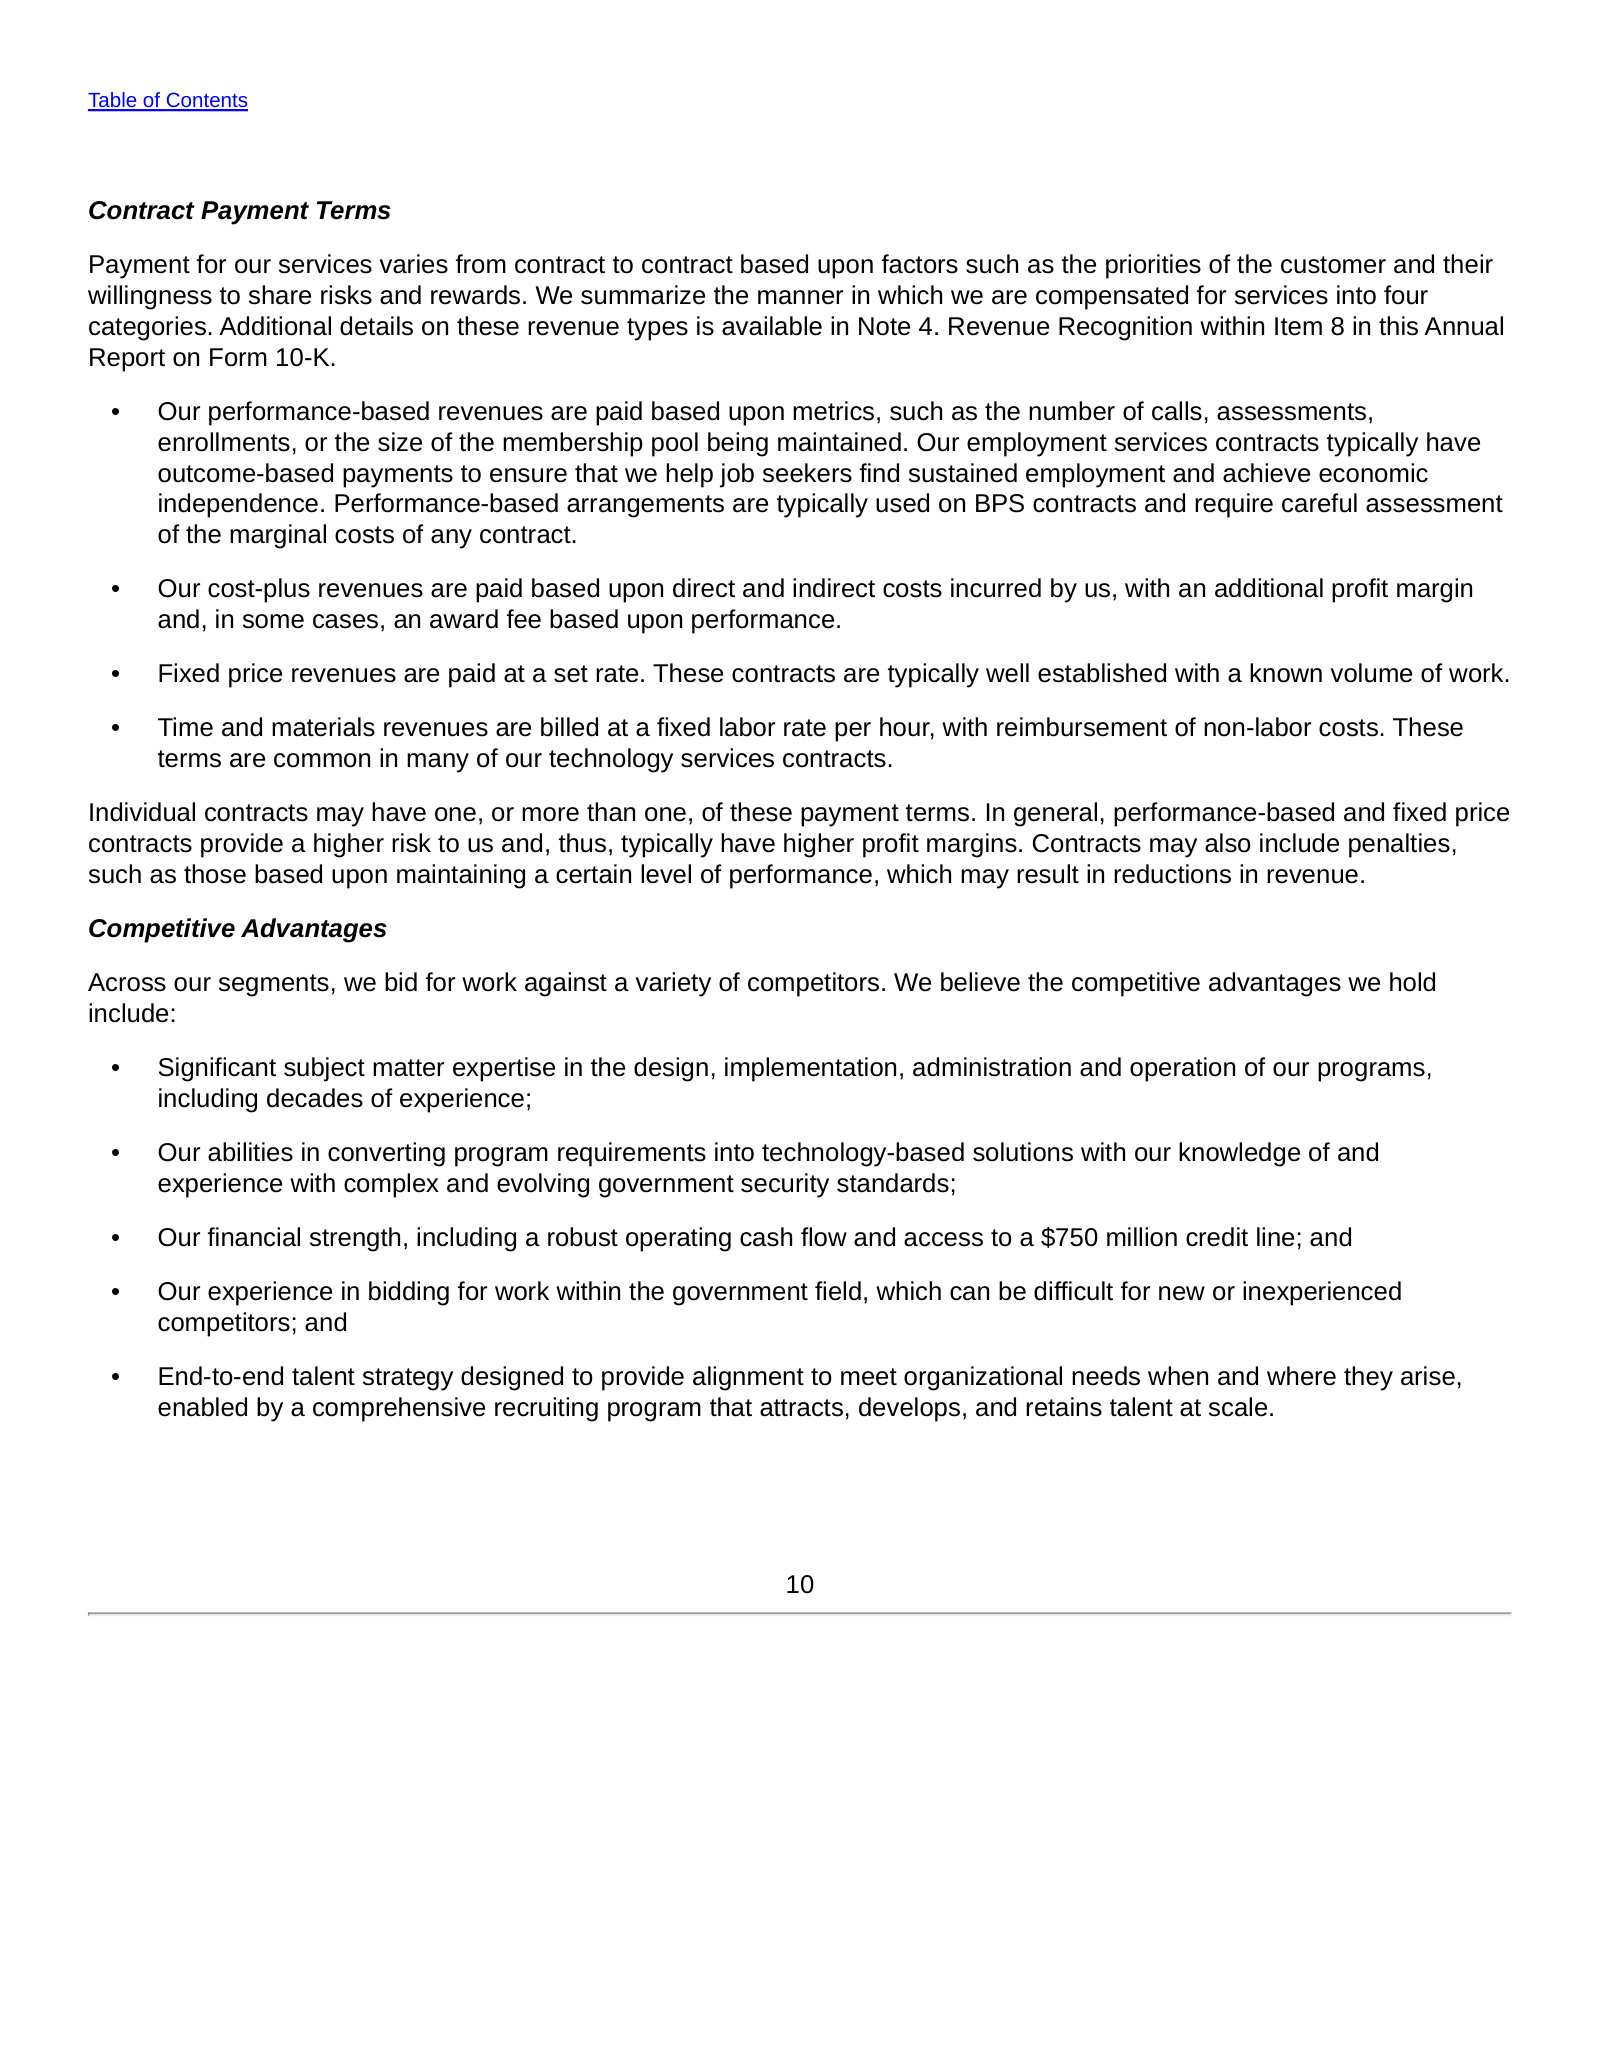
Contract Payment Terms — p. 15 · Read the full section →
The four ways Maximus is paid and which carry the risk — the clearest statement of the revenue model.
Risks Pertaining to Our Client Relationships — p. 22 · Read the full section →
Quantifies customer concentration and the appropriations exposure that comes with a government-only client base.
Our systems and networks are and have been subject to cybersecurity breaches. — p. 29 · Read the full section →
A risk that already materialized: the fiscal 2023 MOVEit breach, still carried as unresolved litigation.
Item 7. MD&A — Results of Operations — p. 49 · Read the full section →
Where management explains FY2025: 2.4% revenue growth, 9.7% operating margin, and what moved them.
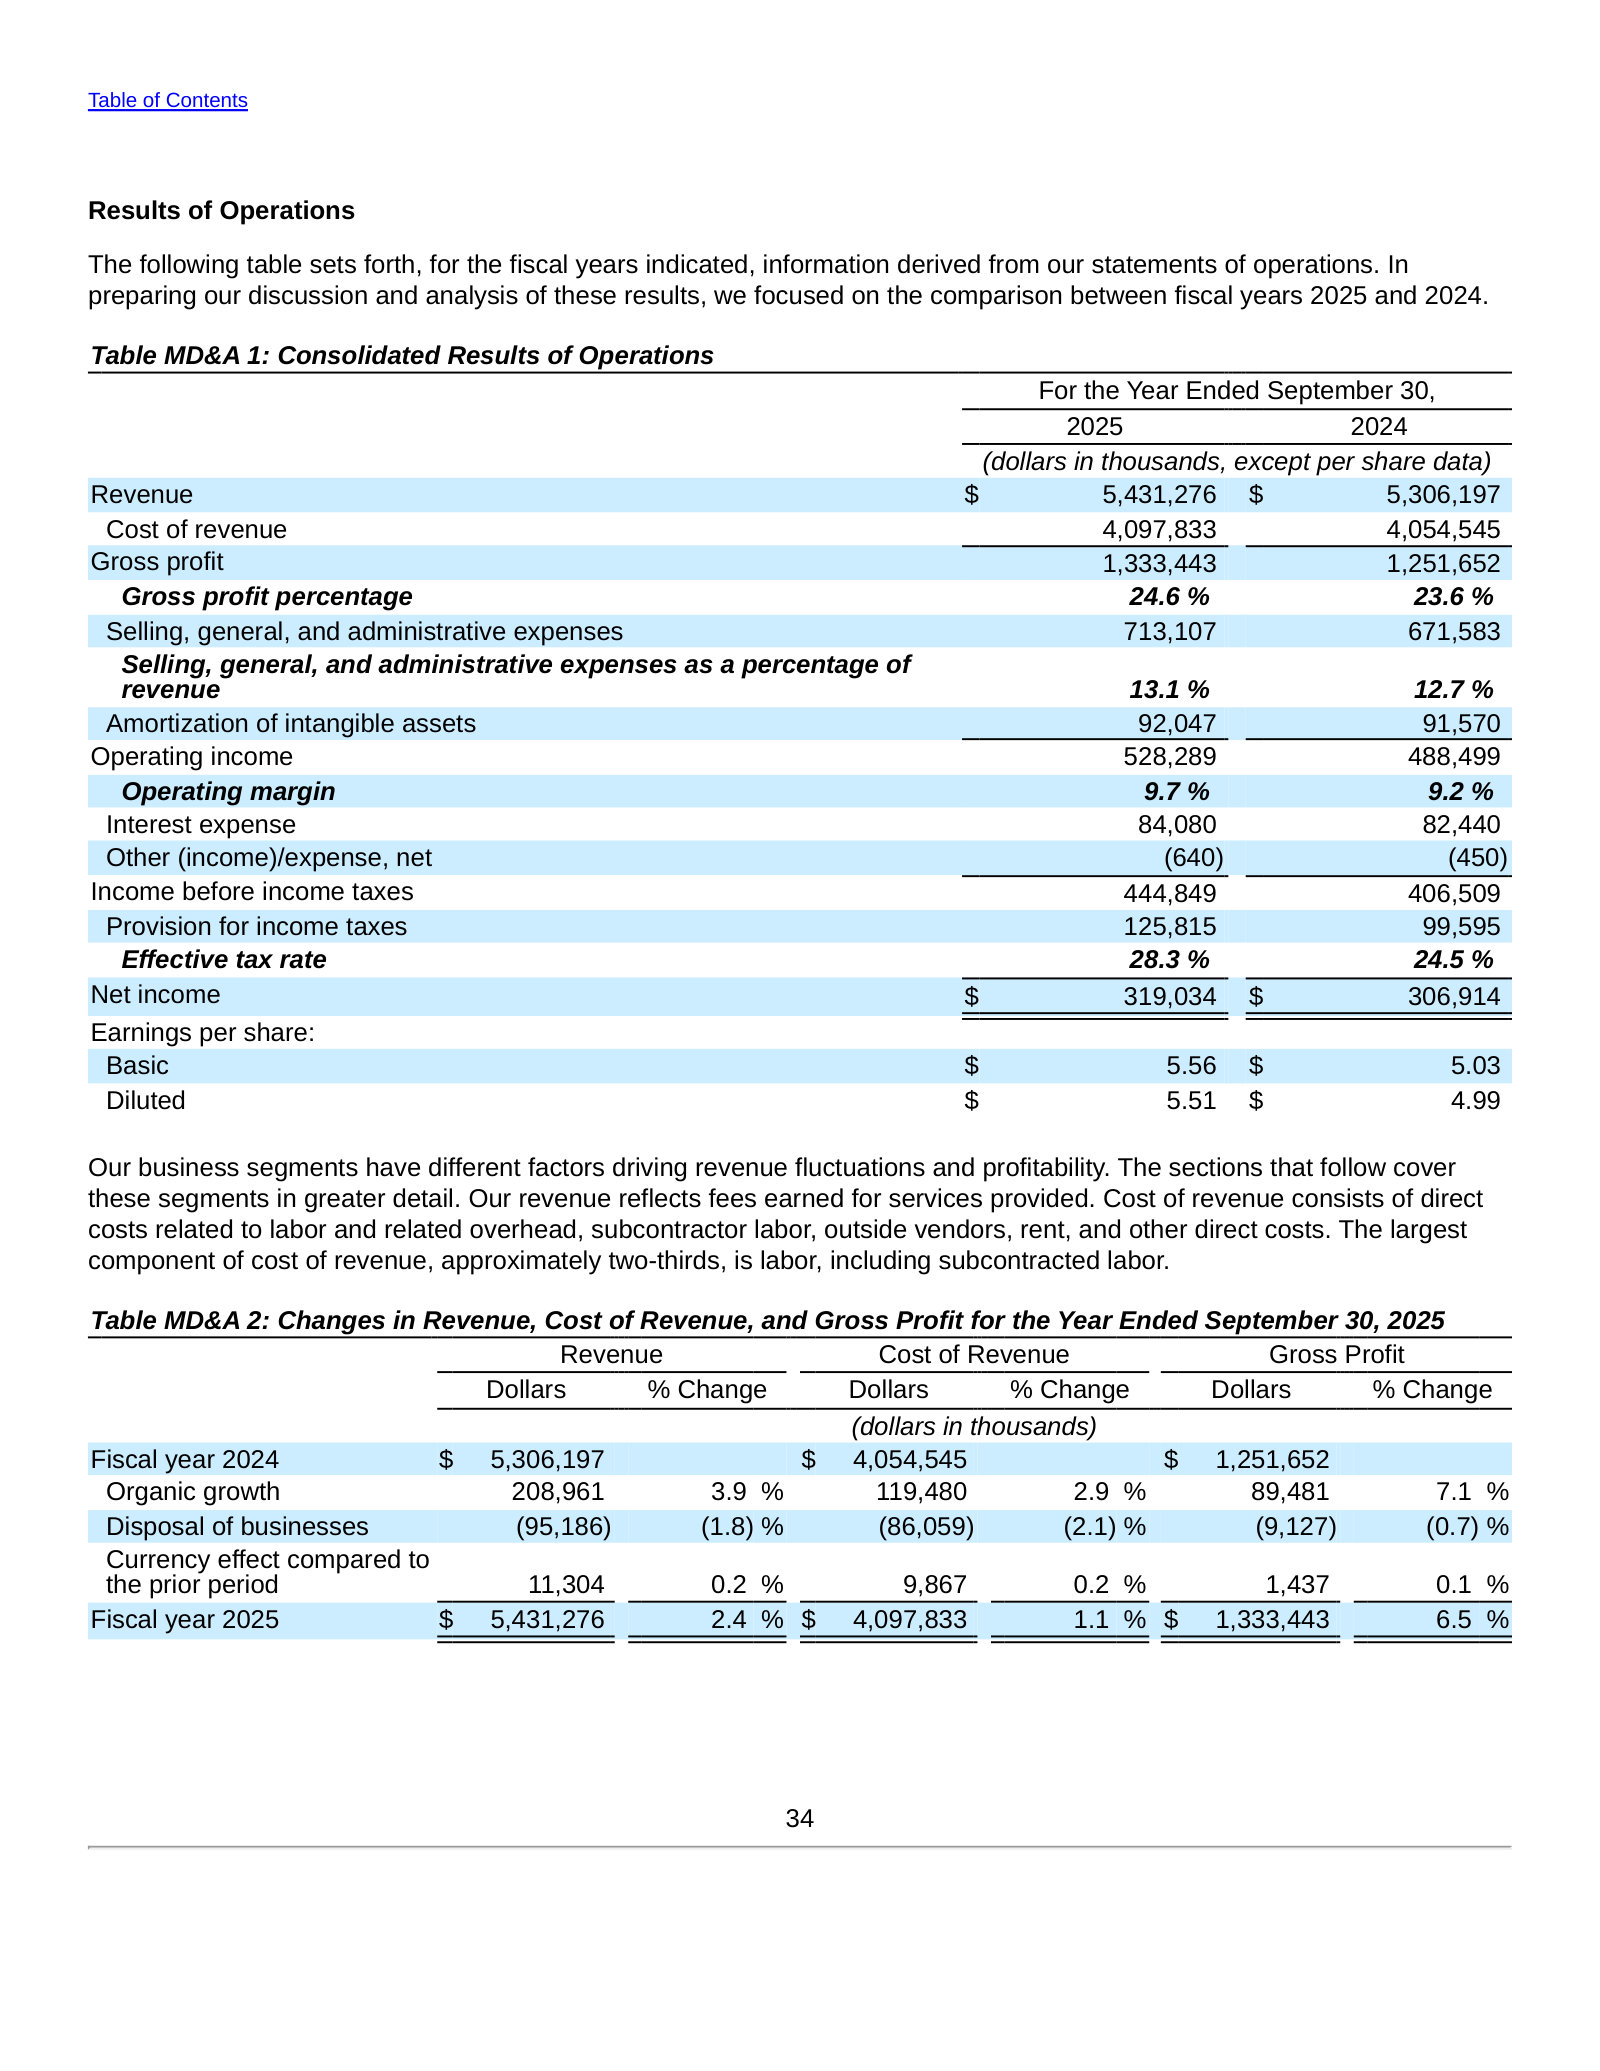
U.S. Federal Services drivers: clinical volumes, FEMA work, fewer penalties, and FY2026 margin guidance.
Our revenue growth was driven by our clinical programs, including medical assessments, as well as from support provided to the Federal Emergency Management Agency (FEMA). […] Our medical assessment revenue benefitted from increased volumes, including those driven by the Honoring our Pact Act, which had necessitated a contract rebid to expand the scale of these arrangements, as well as volume increases from underlying assessment demands. Improvements in performance also reduced our share of penalties incurred, benefitting our profit margin. […] We anticipate operating margins for the U.S. Federal Services Segment in fiscal year 2026 to range between 15.5% and 16%.
p. 51 · Read in context →
U.S. Services Segment — p. 52 · Read the full section →
The Medicaid redetermination bulge is over and OBBBA is the next unknown — this segment's swing factors.
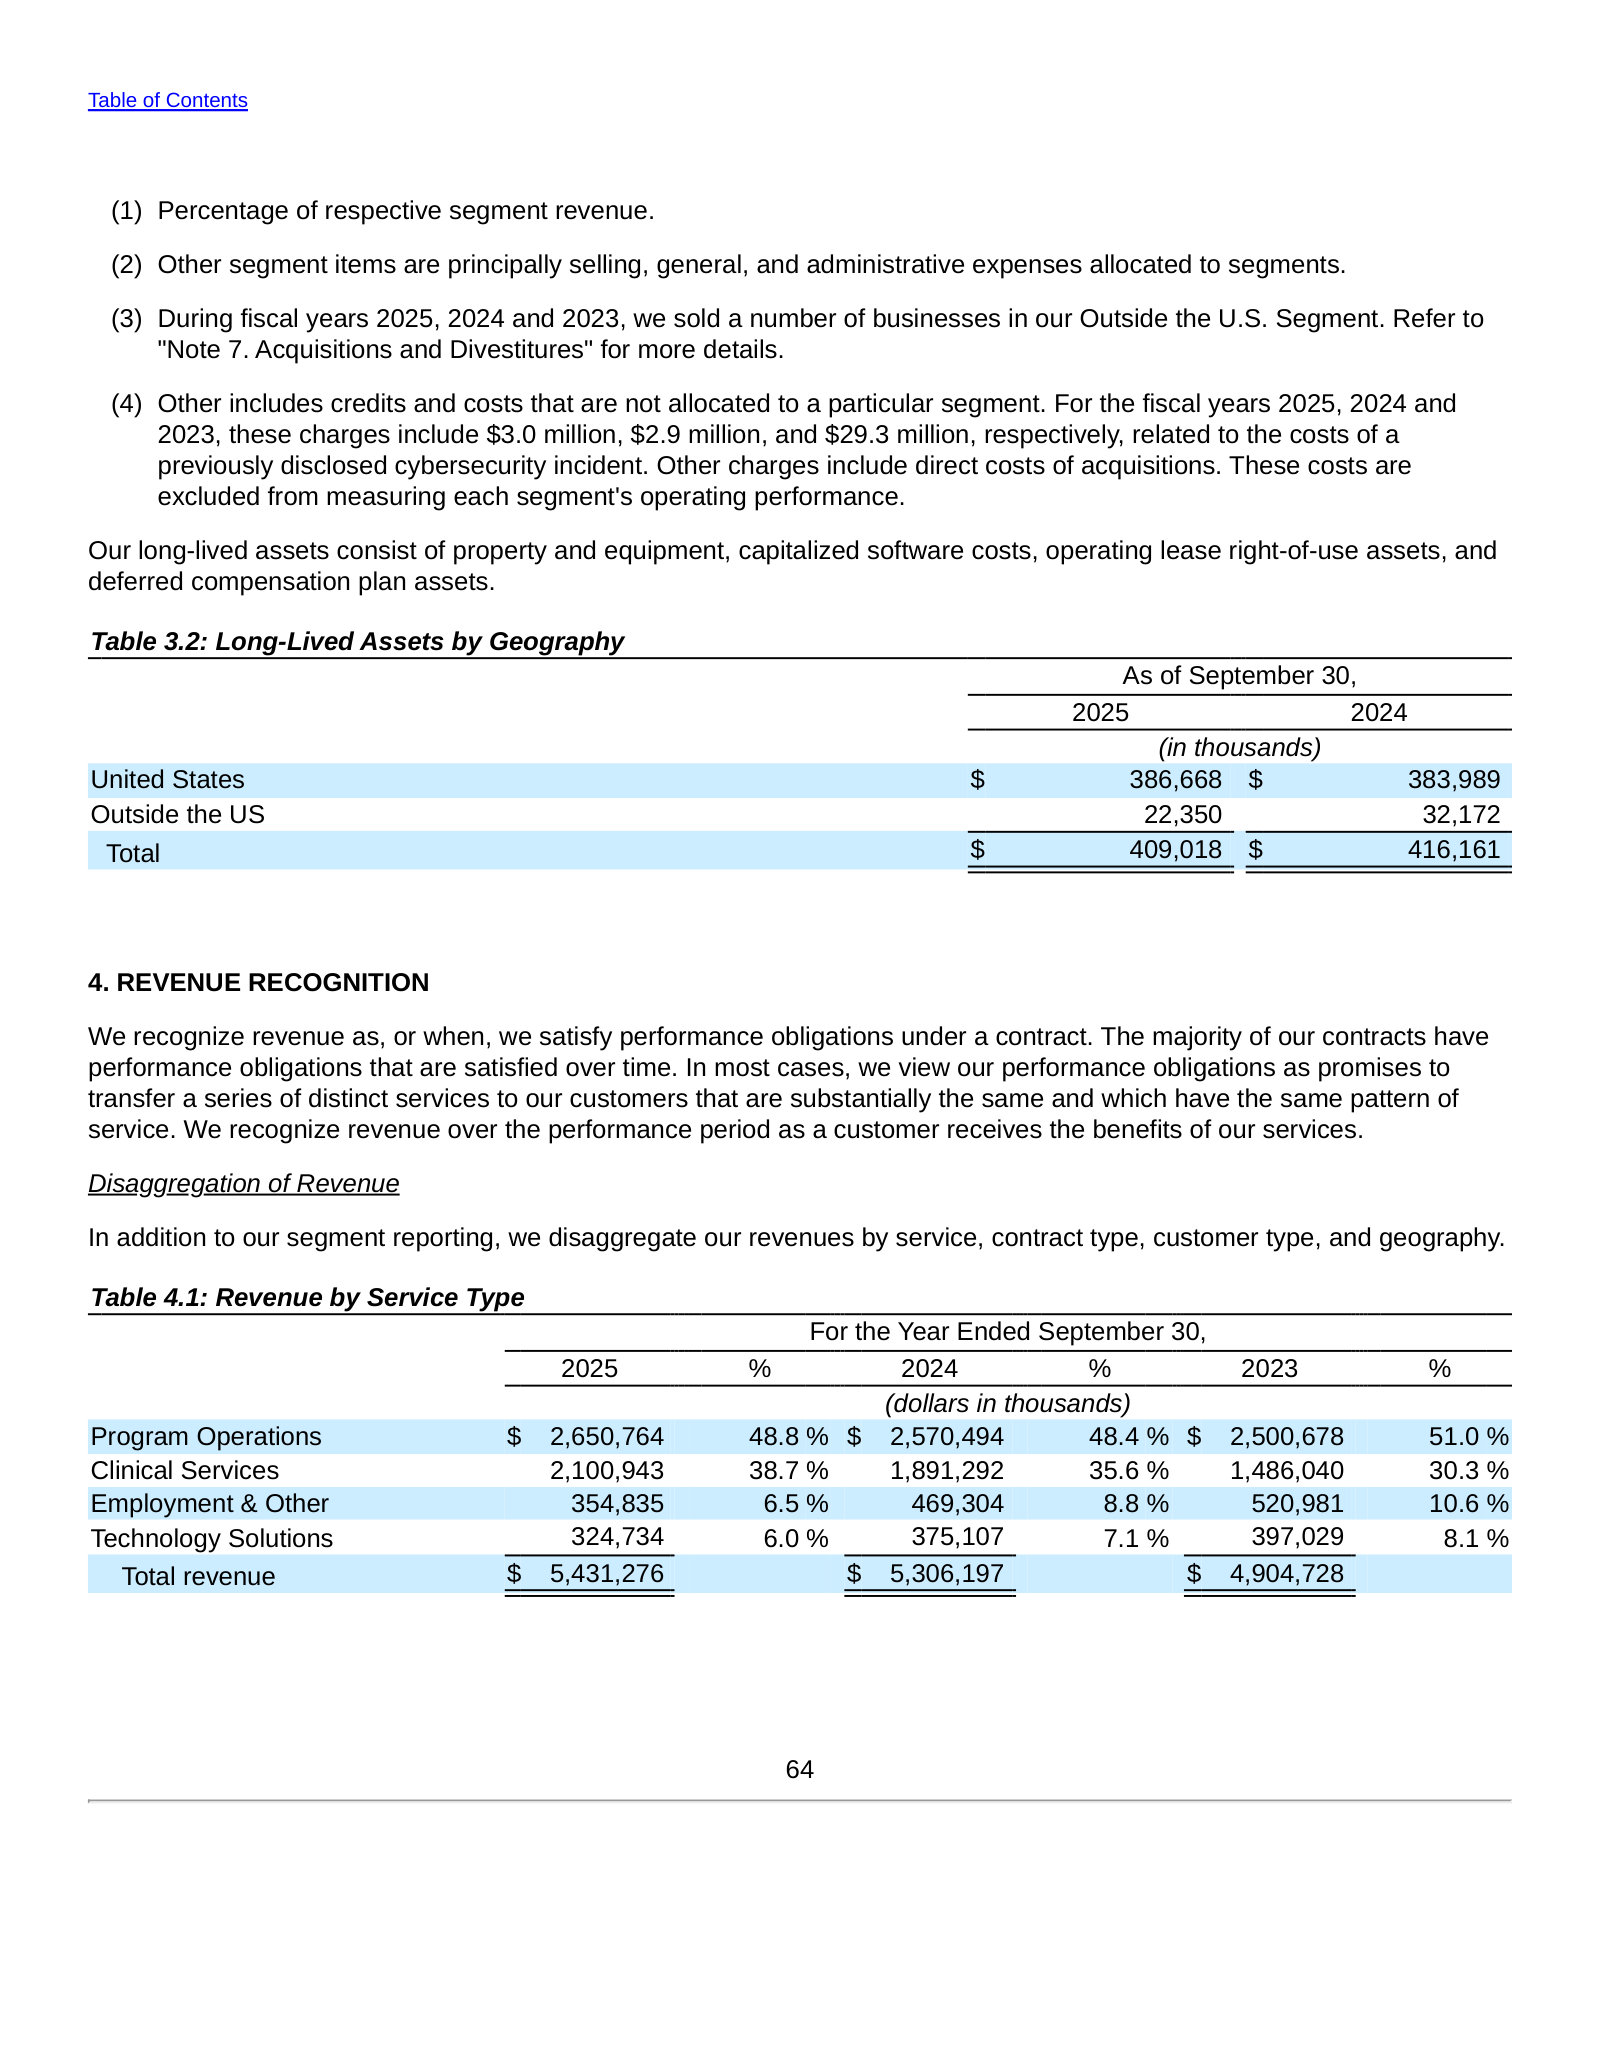
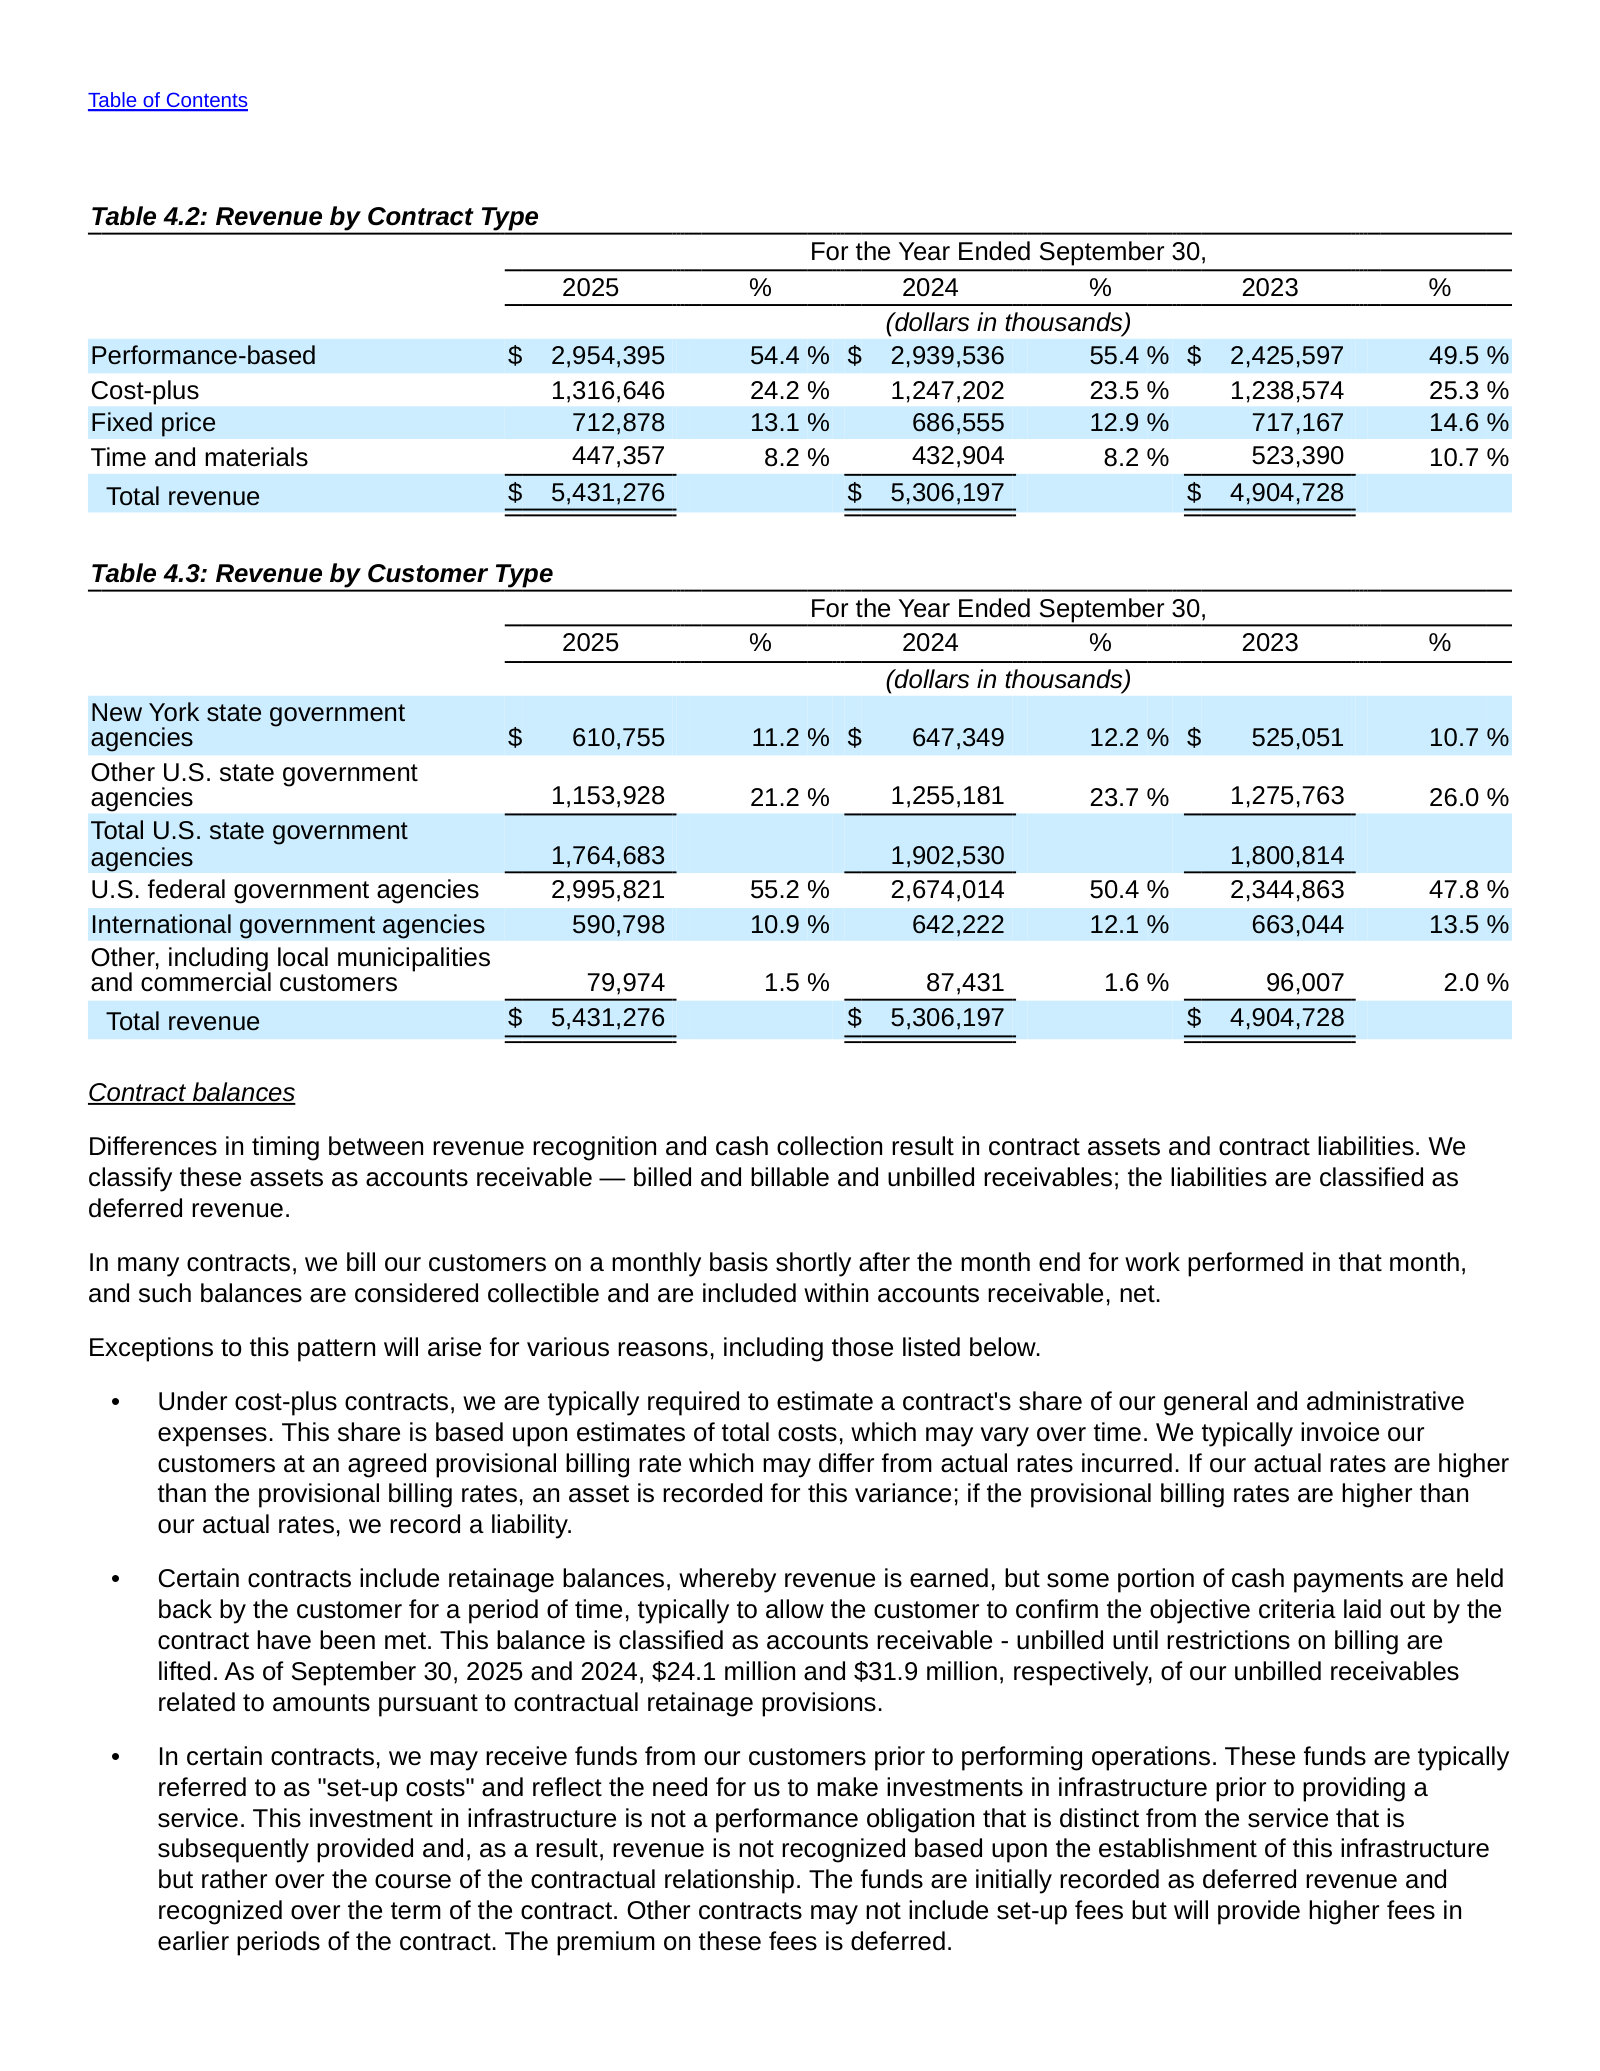
Note 4. Revenue Recognition — Disaggregation of Revenue — p. 85 · Read the full section →
Three years of revenue split by service, contract type and customer — the mix shift the segments alone hide.
Maximus, Inc. — FY2023 Annual Report (Form 10-K) — FY2023
The edition where the Outside the U.S. reset was announced mid-flight, with the segment still loss-making. · Open the full document →
Outside the U.S. Segment — p. 13 · Read the full section →
The same segment two years earlier: performance had 'not met expectations' and the divestiture list was still growing.
The reset in progress — Sweden and a U.K. practice sold, then Italy, Singapore and Canadian employment services.
Our Outside the U.S. Segment generated 14% of our total revenue in fiscal year 2023. […] We are currently reshaping this segment in a thoughtful manner to align with the broader Maximus strategy of pursuing digitally-enabled customer services, clinical capabilities to meet rising demand for health services, and advanced technologies for modernization which is in-demand by government customers worldwide. Recent financial performance of the segment has not met expectations due, in part, to increased volatility from employment services programs dependent on fluctuating macroeconomic conditions. During fiscal year 2023, we divested a small commercial practice in the U.K. and our business in Sweden. During the first quarter of fiscal year 2024, we divested our businesses in Italy and Singapore, as well as our Canadian employment services business.
p. 13 · Read in context →
More annual reports
Maximus, Inc. — FY2024 Annual Report (Form 10-K) — FY2024 · 117 pages · Segments at 52/36/12 — the midpoint of the mix shift, filed weeks before the Australia and Korea sales closed. · Open →
Maximus, Inc. — FY2022 Annual Report (Form 10-K) — FY2022 · 119 pages · Segments at 49/35/16, and the year the current three-to-five-year strategic plan was introduced. · Open →
Maximus, Inc. — FY2021 Annual Report (Form 10-K) — FY2021 · 124 pages · Pre-reset baseline: federal 45%, U.S. Services 39%, Outside the U.S. 16%, with COVID programs still central. · Open →
Source: S&P Capital IQ consensus via Xpressfeed · Generated 2026-08-03.
Margin Without Volume
Consensus expects Maximus to earn materially more on a smaller revenue base. FY2026 revenue is set 2.5% below FY2025 reported while EBIT rises 15.4% and normalized EPS rises 14.6%; the revision record over six months tells the same story, with FY2027 EPS marked up 4.5% and FY2027 revenue marked down. The prints agree — three consecutive revenue misses, EPS beats anyway. Two analysts carry the whole tape.
FY2027 EPS is up 4.5% in six months, against a -3.3% revision to FY2027 revenue
FY2027 Normalized EPS
▲ 4.5 % vs six months ago
FY2027 Revenue ($M)
▼ -3.3 % vs six months ago
FY2026 Normalized EPS
▲ 14.6 % vs FY2025 reported
Source: derived from vendor data.
Source: derived from vendor data.
The two lines moved in opposite directions over the same window and neither move was a single jolt. FY2027 normalized EPS stepped 8.68, then 8.92, then 9.07, and has not moved since — a 4.5% mark-up delivered in two increments. FY2027 revenue went the other way, from 5,741 six months ago to 5,589.746 three months ago and 5,551 today, a -3.3% revision of which -0.7% arrived in the last three months.
A margin-led upgrade is what this shape describes: the street is taking revenue out of FY2027 and putting earnings in. Note also what the feed does not carry — revision history exists for FY2027 only, so the same test cannot be run on FY2026, and both series have been unchanged for a month. Direction is the readable signal here, not precision.
Three straight revenue misses, and EPS beat anyway in six of the last eight quarters
Source: derived from vendor data.
The print record splits along the same seam as the revisions. Revenue has come in below consensus three times running — -1.7%, -2.2% and -0.9% — after five quarters of beats. Normalized EPS has kept beating through that run, by 1.6% and 5.3% in the two most recent quarters.
What has changed is the size of the EPS beat, not its direction. The 45.7% and 40.7% surprises in the middle two quarters of FY2025 were the kind of gaps that force estimates up; the last two quarters clear consensus by low single digits. That reads as the street having caught up to the earnings power it under-modelled a year ago, with the revenue line still running slightly ahead of what the business is delivering.
FY2026 is a margin year: revenue -2.5%, EBIT +15.4%, GAAP EPS +34.9%
Source: derived from vendor data.
FY2026 is the year the tape is really making a claim about. Revenue falls 2.5% against FY2025 reported, and every line below it rises: EBITDA 6.8%, EBIT 15.4%, normalized EPS 14.6%. The GAAP EPS step of 34.9% is the largest of the set and the least informative — it is measured off a FY2025 base depressed by the gap between reported and normalized earnings, discussed below.
FY2027 is a different year entirely. Revenue returns to 4.8% growth, and the earnings lines converge on it at 4.6% to 7.5%. So the consensus is not underwriting a durable margin engine; it is underwriting one step-change in FY2026 and normal operating leverage thereafter.
Source: derived from vendor data.
Consensus gross margin climbs from 22.4% to 26.0%, then gives a little back
Source: derived from vendor data.
The margin tab is where the FY2026 earnings step comes from. Consensus gross margin runs 22.4% and 22.05% in the first half of FY2025 and reaches 25.7% and 26.0% in the second half of FY2026 — the highest quarterly figures anywhere in the visible tape. It then settles back to 25.1% and 25.0% in FY2027, consistent with the annual line easing from 25.4% to 25.3%.
The revenue tab shows what is not happening alongside it. Quarterly revenue sits in a narrow band from 1,306 to 1,348 across six quarters spanning reported and estimated periods, then steps to 1,409 in 1Q27. That step is the entire FY2027 growth reacceleration, and it is worth knowing that the FY2027 quarterly rows carry a single contributor where the annual rows carry two. Driver-level detail behind these quarters sits on the Visible Alpha tab; the headline tape supports the shape and not the cause.
The gap between GAAP and normalized EPS almost halves in FY2026
Source: derived from vendor data.
FY2025 reported GAAP EPS of 5.51 against normalized EPS of 7.36 leaves a 1.85 gap. Consensus carries that gap at 1.00 in FY2026 and marginally wider in FY2027. Most of the headline 34.9% GAAP EPS growth in FY2026 is therefore the gap closing rather than the operating business doubling its pace — the normalized line, up 14.6%, is the cleaner read.
Whatever sits in that reconciliation is not identified in this feed, so the change should be read as an assumption the street is carrying, not an explained one.
Two analysts carry this tape, and the FY2027 quarterly path rests on one
Source: derived from vendor data.
There is no genuine disagreement to report here, because there is barely a consensus. The two contributors sit within 8.4 to 8.47 on FY2026 normalized EPS and within 5,273.8 to 5,317.89 on FY2026 revenue. The widest gap anywhere is FY2027 EBITDA, 767.9 to 800.178 — and even that is one broker against another, not a spread.
The practical consequence is that every figure on this page moves if either contributor changes its model, and the FY2027 quarterly shape moves if the single contributor behind it does. Treat the direction of revision as the signal and the level as provisional.
Both ratings are Outperform, on a target range of $85 to $125
Consensus Target (mean)
Target Low
Target High
Source: derived from vendor data.
Both in-consensus recommendations are Outperform, with no buy, hold, sell or underperform ratings recorded, and the mean and median target are the same at 105. The high and low targets are set by the same two contributors that produce every estimate above, so the range is a description of two views rather than a market-wide band. This feed carries no share price, so nothing here should be read as implied upside.
Visible Alpha broker models via S&P Xpressfeed · 1 brokers · 261 line items · freshest revision 2025-08-11.
Federal Profit Rolls Over
This feed is one broker's complete model, not a consensus: every line carries a single contributor, so there is no dispersion to read. What it says is specific. Revenue compounds 3% to 4% a year through FY-2027, but group profit peaks in FY-2026 — U.S. Federal Services operating income falls 13.5% in FY-2027 on a 13.8% step-up in that segment's own SG&A, while Health Services becomes the only segment adding profit dollars.
Federal Services stops paying: operating income down 13.5% on revenue up 3.2%
Revenue, FY-2027
Operating Margin, FY-2027
Operating EPS, FY-2027
Net Debt / EBITDA, FY-2027
Source: derived from vendor data.
The segment split is where the whole modelled story sits. U.S. Federal Services is the largest business and keeps growing — but its profit contribution is modelled to peak in FY-2026 and then drop 13.5%, even as its revenue still rises 3.2%. Health Services moves the other way: operating income up 20.5% in FY-2027 on 5.3% revenue growth. Human Services is small and shrinking on both lines.
Source: derived from vendor data.
The quarterly view dates the turn precisely. Federal operating income holds a tight band through FY-2026 and then falls in every modelled FY-2027 quarter; Health Services jumps a step in 1QFY-2027 and holds the higher level. The two lines converge sharply over the eight quarters, which is the single most consequential thing in this model.
The step-up is SG&A inside Federal Services, and it is not matched anywhere else
Source: derived from vendor data.
Federal SG&A grinds down through FY-2026 and then jumps in 1QFY-2027, settling well above the prior run-rate: for the full year it rises 13.8% on revenue up 3.2%. Health Services SG&A does the opposite, falling 4.8%, which is why that segment converts its 5.3% revenue growth into 20.5% profit growth. Whatever the broker is modelling — bid and transition costs, a contract mix shift, reinvestment — it is booked in one segment and not spread across the group.
Revenue keeps compounding; the mix of where it comes from barely moves
Source: derived from vendor data.
Group revenue grows 3.4% in FY-2027. Federal remains much the largest layer and adds the most dollars; Health grows fastest; Human Services shrinks in both years. The reported and organic growth rates only part company in FY-2027, and in opposite directions by segment — Federal's organic rate runs above its reported rate, Health's below.
Source: derived from vendor data.
Reported and organic growth are identical for every segment in FY-2026, so the model carries no acquisition or disposal effect that year. In FY-2027 they separate: Federal's organic rate of 4.6% sits above a reported 3.2%, implying something running off the top line, while Health's reported 5.3% runs ahead of 4.0% organic.
FY-2026 is the profit peak on every group measure
Source: derived from vendor data.
Operating income falls 4.5% and EBITDA 2.4% in FY-2027 against revenue up 3.4% — the compression is entirely a margin story, not a volume one. Operating EPS follows: 7.45 in FY-2025, 7.70 in FY-2026, then 7.13, a 7.4% decline. Group margins say the same thing in one line each.
Source: derived from vendor data.
Gross margin erodes in a straight line across all three years, so the FY-2026 operating peak is made below the gross line, by SG&A discipline that then reverses. Free cash flow margin is the widest swing of the five, from 8.6% to 6.8%.
Cash conversion is the sharper decline: free cash flow down 18.2%
Source: derived from vendor data.
Free cash flow falls 18.2% in FY-2027, more than twice the fall in operating EPS, and operating cash flow falls 15.4% — the working-capital release that flattered FY-2025 and FY-2026 reverses to a modest drag, so cash conversion deteriorates faster than reported profit. Free cash flow per share goes 7.92, then 8.35, then 6.80. On a modelled forward path this is the line that would move a cash-return case, and it is the weakest one here.
The balance sheet is the offset — and it is not a straight line
Source: derived from vendor data.
Gross debt amortises steadily. Net debt does not: it drops through FY-2026, then jumps back in 1QFY-2027 on a negative free-cash quarter before resuming its fall. Net debt / EBITDA still ends at 0.37x against 1.23x in FY-2025, so leverage falls by roughly two-thirds even as earnings decline. That is the one part of the model that improves through FY-2027, and it is what keeps a shrinking profit line from reading as a shrinking business. The total debt line has no value for 1QFY-2027 in this feed; the chart connects across the gap.
What this feed cannot tell you
Three limits matter for how much weight to put on the above. The model is a full one — segments, cash flow and balance sheet, annual and quarterly — but it is one analyst's, and the freshest revision in the feed predates the feed date by close to a year, so the periods the feed labels as historical are themselves forecasts that have not been marked to actuals. Several lines have had individual stale quarters dropped, which is why revenue carries no 1QFY-2027 value. And the model's own year-over-year fields do not tie to its own FY-2027 levels; every change quoted on this page is computed from the levels shown, not from those fields.
Headline P&L consensus, momentum and beat/miss live in the CapIQ tab.
Source: S&P Capital IQ transcripts via Xpressfeed · latest indexed call 2026-05-07 · generated 2026-08-03.
Latest call digest
Maximus, Inc., Q2 2026 Earnings Call, May 07, 2026 · 2026-05-07T13:00:00
Q2 FY2026 — May 7, 2026. Prepared remarks led with margin, not growth. Revenue was $1.31 billion, flat against guidance and down against a prior-year quarter that carried natural disaster work and elevated clinical volumes; adjusted EBITDA margin was 14.4% and adjusted EPS $2.07, versus 13.7% and $2.01 a year earlier. Two offsetting one-offs ran through the quarter: a $6.9 million non-cash impairment of a capitalized software asset in U.S. Services ($0.09), and a $4.2 million discrete R&D tax credit (roughly $0.08). CFO David Mutryn raised full-year adjusted EPS guidance by $0.20 to $8.25–$8.55 — the second consecutive raise — lifted the EBITDA margin guide to approximately 14.2%, reiterated revenue of $5.2–$5.35 billion and free cash flow of $450–$500 million, and raised the near-term EBITDA margin target range from 10%–13% to 12%–15%. The Board refreshed the buyback for up to $400 million effective May 11, after $111 million of repurchases in the quarter and $40 million more through May 1.
The Q&A reality was narrower than the prepared remarks. Only one analyst asked questions — Will Gildea of CJS Securities — and his line of inquiry was less about the raise than about the two soft spots. First, cash: DSO stayed at 78 days on administrative delays at a single major federal customer, the same customer behind the FY2025 build; management expects AR to stay roughly flat in Q3 before declining in Q4, and expanded its receivables purchase agreement ceiling from $250 million to $350 million. Second, the divergence between segments: U.S. Federal Services margin reached 17.6% while U.S. Services printed 9.3% (10.9% excluding the impairment) on revenue down to $416 million from $442 million. Asked directly why technology leverage shows up in one segment and not the other, CEO Bruce Caswell gave the most substantive answer of the call — larger federal contract scale, state customers expressing caution on AI adoption without guardrails, multiple legacy-system integration points, and limited state bandwidth ahead of HR-1 implementation.
What was actually committed: U.S. Services returning to mid-single-digit organic growth in Q4, DSO finishing the year below 70 days, full-year segment margins of approximately 17.5% for U.S. Federal Services and approximately 10.0% for U.S. Services, and roughly breakeven Outside the U.S. Awards remain thin — year-to-date signed contract value of $913 million and a book-to-bill of approximately 0.5x, with the quarterly figure improving to 0.5x from 0.2x. The HR-1 story advanced qualitatively rather than contractually: two states working toward arrangements under existing contracts, one of which management estimates could lift current program revenue by more than 30%, and an HR-1-related pipeline set up 75% quarter over quarter — but final work-requirement regulations are still expected next quarter. The VA medical disability exam recompete, the single largest contract event ahead, has no published timeline; the current contract runs through December 31, 2026.
Participant coverage from the latest call.
| Group | Participants | Count |
|---|---|---|
| Management | Operator; James Francis — Vice President of Investor Relations, Maximus, Inc.; David Mutryn — CFO & Treasurer, Maximus, Inc.; Bruce L. Caswell — President, CEO & Director, Maximus, Inc. | 4 |
| Analysts | Will Gildea — Equity Research Associate, CJS Securities, Inc. | 1 |
Curated latest-call exchanges; one row per analyst topic.
| Analyst | Firm | Topic | What changed in Q&A |
|---|---|---|---|
| Will Gildea | CJS Securities, Inc. | Elevated DSO and buyback capacity | Mutryn traced the 78-day DSO to one major federal customer with complex, partly retroactive invoicing requirements — the same customer that drove the FY2025 build — and said AR there may stay flat in Q3 before declining in Q4. He framed repurchase sizing as a function of near-term liquidity, valuation and the M&A opportunity set rather than a fixed pace. |
| Will Gildea | CJS Securities, Inc. | SNAP offerings beyond Accuracy Assistant | Caswell described the Accuracy Assistant tool as the core, with BPO services wrapped around it to contact beneficiaries and correct data, plus a separate Medicaid community engagement tool covering exemptions, appeals and mobile evidence submission. No revenue sizing or contract timing was offered. |
| Will Gildea | CJS Securities, Inc. | Why U.S. Services revenue fell, and confidence in a Q4 turn | Mutryn attributed the decline to higher prior-year clinical work and state-specific volume dynamics on one larger clinical contract, saying it was not indicative of a broader trend. Confidence in Q4 rests specifically on HR-1-related activity arriving in that quarter — an outcome dependent on regulations not yet final. |
| Will Gildea | CJS Securities, Inc. | Federal margin keeps rising while U.S. Services does not | The hardest exchange of the call. Caswell gave four reasons: federal contracts are larger so automation scales further; state customers deliver services directly to consumers and are more cautious on AI without guardrails; state programs require integration across multiple legacy systems (one state trains staff across five); and states have limited bandwidth and budget while implementing HR-1. |
| Will Gildea | CJS Securities, Inc. | VA recompete timing and Industry Day | Caswell said the current contract runs through December 31, 2026 for all vendors and that the VA has not released a formal rebid timeline; he expects to learn more at the upcoming Industry Day and noted agencies generally can extend contracts while completing a recompete, without saying whether the VA intends to. |
| Will Gildea | CJS Securities, Inc. | Remaining tough federal comparisons | Mutryn flagged the June FY2025 quarter as another tough comp on the surge in clinical volumes, with Q4 a tough comp to a lesser extent. Caswell separately said no recompete other than the veterans exam work warrants calling out, and that rebid determinations moving right can extend incumbent work. |
Theme tracker
Themes are curator-classified across supplied calls.
| Theme | Status | Quarters mentioned | Read-through |
|---|---|---|---|
| AI and automation as the stated source of margin expansion | persisted | Q3 2023, Q4 2023, Q1 2024, Q2 2024, Q3 2024, Q4 2024, Q1 2025, Q2 2025, Q3 2025, Q4 2025, Q1 2026, Q2 2026 | Present in every call in the supplied history, but the framing has moved from governance and pilots (AI Governance Board in Q3 2023, Agent Assist pilots in Q1 2024) to quantified operating leverage — 45% of disputes resolved autonomously on one program in Q1 2026, nearly half the claim-processing effort automated by Q2 2026. This is the mechanism management now points to for the federal segment margin going from 12.2% in FY2024 to a ~17.5% full-year guide. |
| HR-1 / One Big Beautiful Bill Act — Medicaid work requirements and SNAP error rates | emerged | Q3 2025, Q4 2025, Q1 2026, Q2 2026 | First raised on the August 2025 call and now the central growth argument for U.S. Services. The revenue date has stayed stubbornly forward: initially framed as an FY2027 driver, then as high-single to low-double-digit organic uplift layering in over FY2027 into FY2028. Q2 2026 is the first call to point to specific states and an existing-contract mechanism, but final regulations are still pending. |
| Volume moderation from an unusually strong prior year | persisted | Q3 2024, Q4 2024, Q1 2025, Q4 2025, Q1 2026, Q2 2026 | The specific source rotates — Medicaid unwinding excess volumes through FY2024, then clinical surge and natural disaster support through FY2025 — but the pattern is the same: an unforecastable volume benefit lands, guidance is raised, and the following year is spent explaining the comp. Management sized the FY2025 natural disaster work at roughly $100 million on the Q1 2026 call. |
| Weak book-to-bill and slow procurement adjudication | persisted | Q3 2024, Q4 2024, Q1 2025, Q2 2025, Q3 2025, Q4 2025, Q1 2026, Q2 2026 | Trailing-twelve-month book-to-bill has been below 1.0x across the entire window — 0.4x in FY2024, recovering to 0.9x at September 30, 2025, then back to 0.5x in both FY2026 quarters after a shutdown-affected Q1. Management consistently attributes this to rebid timing rather than win rates, and FY2026 guidance assumes virtually no contribution from new work. |
| Collections, DSO and working-capital strain | persisted | Q2 2025, Q3 2025, Q4 2025, Q1 2026, Q2 2026 | DSO ran 73 days, then peaked at 96 days in Q3 2025, dropped to 62 days at fiscal year-end after catch-up collections, then rebuilt to 78 days in both FY2026 quarters. The recurrence at the same major federal customer, and the expansion of the receivables purchase facility ceiling to $350 million, make this a structural feature of the story rather than a one-quarter timing item. |
| Defense and national security as a new growth vector | emerged | Q4 2024, Q3 2025, Q4 2025, Q1 2026, Q2 2026 | Started with a small DoD AI contract in FY2024 and built through CMMC Level 2 certification, a $77 million Air Force award, an $86 million follow-on, a CRADA and expanded use of other transaction authorities. It is also now the stated bias for M&A. Contract values so far are small relative to a $5.3 billion revenue base. |
| CMS contact center recompete and the labor harmony dispute | dropped | Q1 2024, Q2 2024, Q3 2024, Q4 2024, Q1 2025 | Dominated four consecutive calls — GAO protest, Court of Federal Claims suit, a $6.6 billion pipeline entry — and then disappeared entirely once the government cancelled the procurement in late 2024, clearing the contract to run through 2031 on option periods. Its absence since Q1 2025 removes what had been the single largest identified contract risk. |
| DOGE and federal cost-cutting exposure | dropped | Q4 2024, Q1 2025, Q2 2025, Q3 2025 | A standing agenda item across four calls, sized by management at roughly $4 million of FY2025 revenue and later at under 0.5% of FY2025 revenue. It has not been raised since August 2025; the federal risk discussion has shifted to shutdown effects and acquisition-workforce shortages. The disappearance reads as the risk resolving small rather than as an unanswered question. |
Guidance ledger
Quotes, calls, and speakers are source-verified; outcomes are curator-classified.
| Verbatim guidance | Call | Speaker | Curator outcome | Outcome note |
|---|---|---|---|---|
| “Adjusted EPS, excluding intangibles, amortization and divestiture-related charges, is now projected to be between $6 and $6.20 per share.” | Maximus, Inc., Q3 2024 Earnings Call, Aug 08, 2024 · 2024-08-08T13:00:00 | David Mutryn | kept | The November 2024 call reported full-year FY2024 adjusted EPS of $6.11, inside the range. |
| “For fiscal 2025, revenue is projected to be between $5.275 billion and $5.425 billion. Adjusted EBITDA margin is estimated to be approximately 11%, and adjusted EPS is projected to be between $5.70 and $6 per share.” | Maximus, Inc., 2024 Earnings Call, Nov 21, 2024 · 2024-11-21T14:00:00 | David Mutryn | kept | FY2025 finished at $5.43 billion of revenue, a 12.9% adjusted EBITDA margin and $7.36 adjusted EPS per the November 2025 call — revenue at the top of the range and margin and EPS well above it, after three in-year raises. |
| “our adjusted EPS guide increases by $0.20 to range between $5.90 and $6.20 per share.” | Maximus, Inc., Q1 2025 Earnings Call, Feb 06, 2025 · 2025-02-06T14:00:00 | David Mutryn | kept | Superseded by two further raises in the same year; FY2025 adjusted EPS was $7.36. |
| “Our adjusted EPS guidance increases by $0.40 to range between $6.30 and $6.60 per share.” | Maximus, Inc., Q2 2025 Earnings Call, May 08, 2025 · 2025-05-08T13:00:00 | David Mutryn | kept | Raised again in August 2025 to $7.35–$7.55 and delivered at $7.36 for the full year. |
| “We are raising our free cash flow guidance to between $370 million and $390 million.” | Maximus, Inc., Q3 2025 Earnings Call, Aug 07, 2025 · 2025-08-07T13:00:00 | David Mutryn | missed | The November 2025 call reported FY2025 free cash flow of $366 million, below the raised range, despite $642 million of free cash flow in the fourth quarter alone. |
| “our guidance assumes that we will collect the $224 million now billed related to that contract prior to September 30, 2025.” | Maximus, Inc., Q3 2025 Earnings Call, Aug 07, 2025 · 2025-08-07T13:00:00 | David Mutryn | kept | DSO fell from 96 days to 62 days at September 30, 2025, which the November 2025 call attributed to catching up collections on the two contracts that had driven the elevated balance. |
| “For fiscal 2026, revenue is projected to be between $5.225 billion and $5.425 billion with a midpoint of $5.325 billion. Adjusted EBITDA margin is estimated to be approximately 13.7%, and adjusted EPS is projected to be between $7.95 and $8.25 per share” | Maximus, Inc., Q4 2025 Earnings Call, Nov 20, 2025 · 2025-11-20T14:00:00 | David Mutryn | pending | Revenue was narrowed to $5.2–$5.35 billion in February 2026 for a divestiture and new-work timing; margin and EPS have since been raised twice, to approximately 14.2% and $8.25–$8.55. |
| “We expect the U.S. Federal Services margin to range between 16.5% and 17%, a 100 basis point improvement from prior guidance.” | Maximus, Inc., Q1 2026 Earnings Call, Feb 05, 2026 · 2026-02-05T14:00:00 | David Mutryn | pending | Raised again in May 2026 to approximately 17.5% for the full year; the segment printed 17.6% in the second quarter. |
| “Our adjusted EPS guidance increases by $0.20 and is now expected to range between $8.25 and $8.55 per share.” | Maximus, Inc., Q2 2026 Earnings Call, May 07, 2026 · 2026-05-07T13:00:00 | David Mutryn | pending | Management describes the midpoint as 14% year-over-year growth. FY2026 is not complete in the supplied call history. |
| “we expect collections to accelerate and thus DSO to trend downward and finish fiscal year 2026 below 70 days” | Maximus, Inc., Q2 2026 Earnings Call, May 07, 2026 · 2026-05-07T13:00:00 | David Mutryn | pending | Management expects DSO to remain elevated at June 30 and improve in the fourth quarter; the $450–$500 million free cash flow guide depends on this. |
| “we are raising our near-term adjusted EBITDA margin target range to 12% to 15%” | Maximus, Inc., Q2 2026 Earnings Call, May 07, 2026 · 2026-05-07T13:00:00 | David Mutryn | pending | Replaces the 10%–13% range set on the November 2024 call. Management says it expects to operate toward the upper end in periods with stable volumes, while noting new program ramps and mix can affect any given year. |
Q&A pressure map
Question counts and firms are curator tallies; analyst coverage shown above.
| Topic | Questions | Firms | Pressure / response |
|---|---|---|---|
| VA medical disability exams — volumes, capacity and the recompete | 15 | Stifel, Nicolaus & Company, Incorporated, Research Division, CJS Securities, Inc., Raymond James & Associates, Inc., Research Division | The most persistently pressed topic in the window, and the one where analysts have pushed back hardest on management's own framing. Brian Gesuale of Raymond James twice challenged the volume outlook directly — arguing in August 2025 that the comps looked easy given industry-wide added capacity, and pressing in February 2026 on whether the shutdown slowed the VA's push of cases to vendors. Management conceded the first point in part and held firm on the second. |
| U.S. Services revenue decline and the path back to growth | 7 | CJS Securities, Inc., Raymond James & Associates, Inc., Research Division | Concentrated in the two FY2026 calls. Analysts have repeatedly asked how transitory the lower volumes are, whether the segment can grow for the year, and what drives the promised Q4 turn. Management's answers have been consistent — seasonality and contract structure, not a population or demand trend — but the return to growth has stayed one or two quarters ahead throughout. |
| Sizing and timing of the HR-1 / OBBBA opportunity | 7 | CJS Securities, Inc., Raymond James & Associates, Inc., Research Division | Analysts have asked for quantification on every call since August 2025. The most specific answer came in February 2026: a high-single to low-double-digit organic growth opportunity for U.S. Services, layering in over FY2027 and FY2028. Management has been candid that the estimate carries a multitude of assumptions. |
| Federal policy disruption — DOGE, shutdown and procurement delays | 6 | CJS Securities, Inc., Raymond James & Associates, Inc., Research Division | Pressed on every call from November 2024 through November 2025. Management quantified the exposure early and repeatedly — roughly $4 million of FY2025 revenue from DOGE actions, later restated as under 0.5% of FY2025 revenue, and fewer than a dozen of nearly 40,000 employees affected by shutdown funding curtailments. The topic has not been raised since. |
| Cash conversion, DSO and capital deployment | 4 | CJS Securities, Inc., Raymond James & Associates, Inc., Research Division | Asked less often than the operating topics but consistently at the points where cash and buybacks interact. On the latest call this was the opening question, pairing the elevated DSO with the refreshed authorization — a fair read that the buyback is being funded against collections that have not yet arrived. |
| Segment-level guidance detail | 3 | CJS Securities, Inc. | Worth flagging as a limit on disclosure rather than evasion. Asked in August 2025 for a Q4 revenue split by segment, Mutryn said plainly that it was too early and that he was hesitant to give segment-level guidance at that stage. Segment revenue guidance has not been provided since; only segment operating margin ranges are given. |
Language shifts
Only language evidence verified against the referenced component is shown.
| Observation | Verbatim evidence | Call ID | Component |
|---|---|---|---|
| First program-level write-off language in the window. After several quarters in which the only adjustments were divestiture charges and severance, Q2 FY2026 introduced a customer-decision-driven impairment of previously capitalized software — a reminder that capitalized technology spend carries realization risk when a contract changes. | “A recent decision by this customer led us to writing off the balance of the asset, which was $6.9 million or $0.09 per share impact to the U.S. Services segment operating income.” | 1994106528 | 2 |
| New caution vocabulary attached to AI, and pointed at customers rather than the company. Across ten prior calls AI was described only as an opportunity and a differentiator; this is the first time management has named customer reluctance as a reason a segment's margin is not improving. | “they've expressed, I will say, decidedly more caution in the adoption of AI and other automation tools” | 1994106528 | 12 |
| The procurement-environment language hardened. Prior calls described awards 'pushing to the right' as a timing dynamic with a silver lining for incumbents; the latest call adds an explicit staffing shortage and rising protests as compounding causes, while still asserting momentum is building. | “On the federal side, particularly in civilian agencies, the shortage of acquisition professionals continues to make forecasting procurement time lines difficult. In an environment where awards have shifted right, protests have increased, further delaying outcomes.” | 1994106528 | 3 |
| Buyback language moved from 'opportunistic' — the standing formulation on every prior call — to an explicit valuation judgment. Management is now saying it believes the shares are mispriced, not merely that it buys when conditions allow. | “To be more direct, we prioritize repurchasing when we believe our share price does not reflect the intrinsic value of the business based on a disciplined and conservative assessment.” | 1994106528 | 2 |
| Superlative framing has receded. The August 2025 call opened on record results and 24% year-over-year EPS growth; the FY2026 calls open on consistency, visibility and durability, with growth arguments deferred to FY2027. The tone change tracks the revenue trajectory rather than the earnings trajectory. | “I'm excited to share another record-breaking quarter for Maximus earnings.” | 1952985177 | 2 |
| Durability is now the operative claim on margins. Management is asserting that the technology-driven gains are structural rather than volume-driven, which is what justifies raising the near-term target range while revenue is flat. | “Much of the improvement has come from technology enhancements and cost discipline that we believe have staying power.” | 1994106528 | 2 |
Across twelve calls the earnings line has consistently outrun the top line, and the latest call extends that: the third consecutive year of margin-led guidance raises against revenue that management itself describes as holding within a range. The debate the transcripts sharpen is whether the technology leverage that took federal segment margin from 12.2% to a ~17.5% guide can travel to U.S. Services, where management has now given four specific reasons it cannot travel quickly. Everything on the growth side — HR-1 conversion, the VA recompete, the pipeline — sits in FY2027, and the awards data has not yet moved.